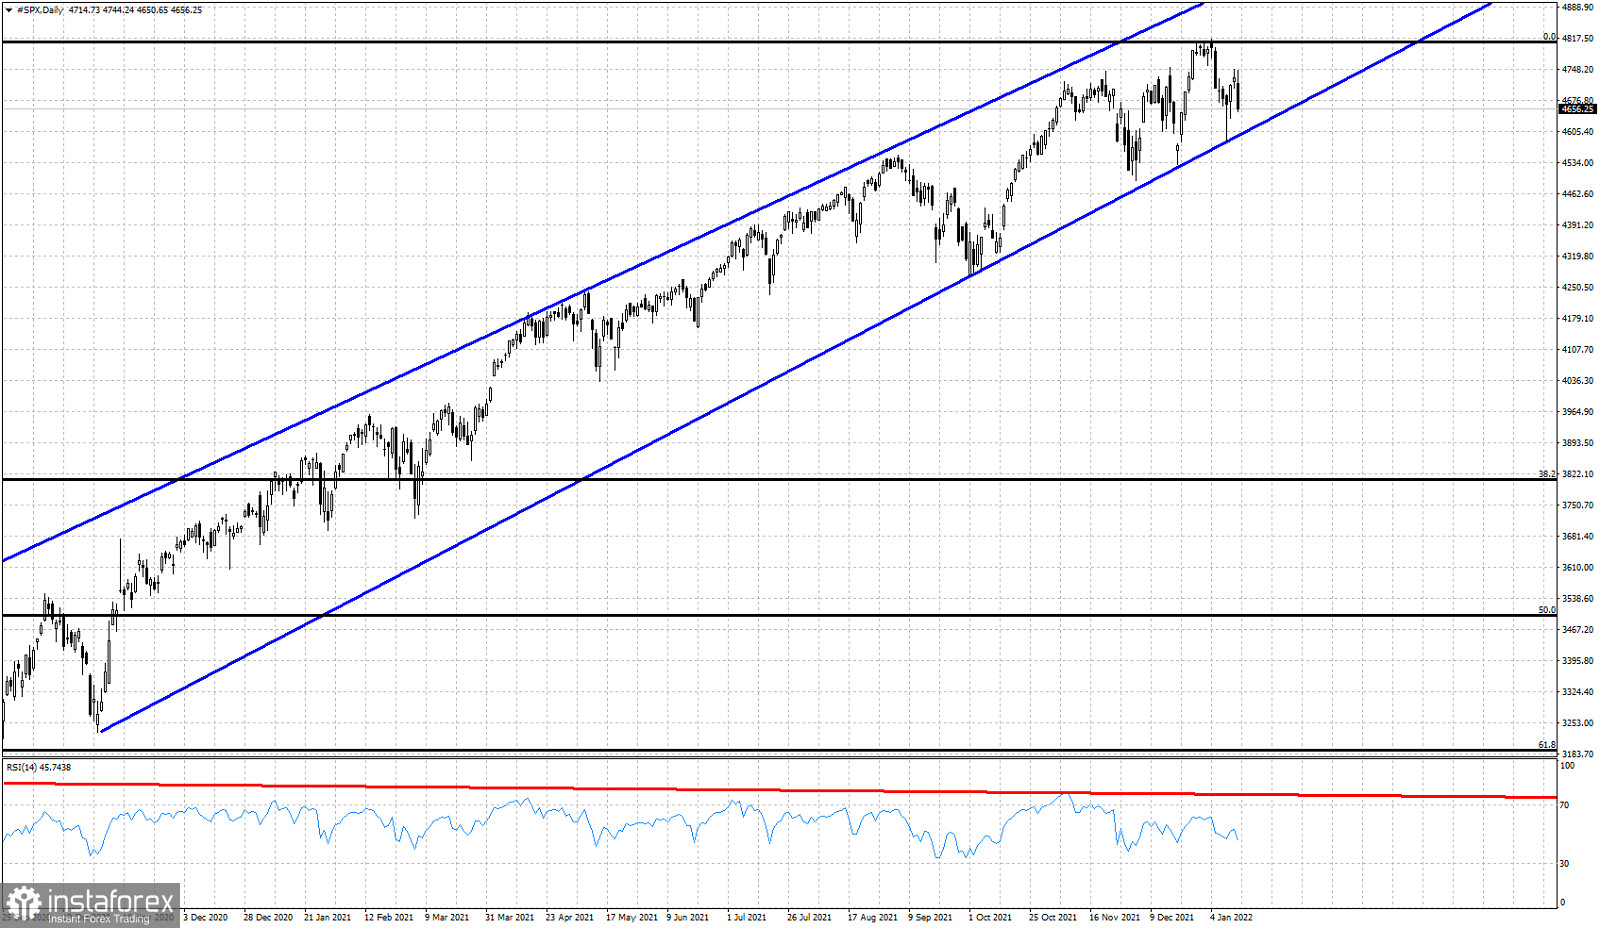
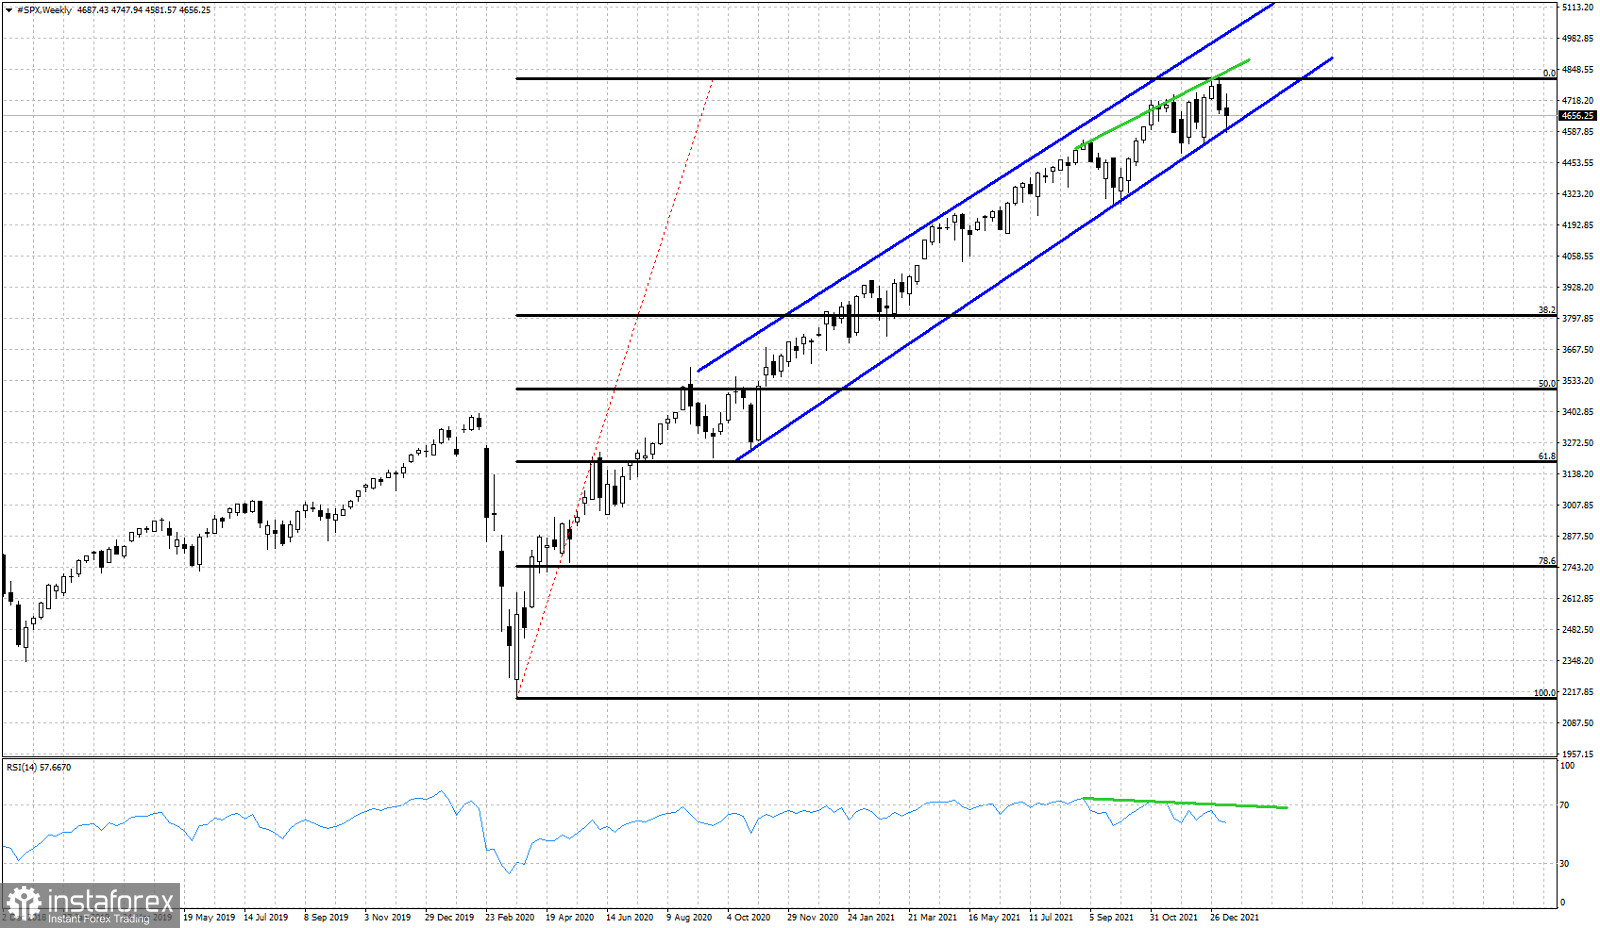
This week SPX tested the lower weekly channel boundaries and bounced strongly. Near the end of the week price has turned negative on a weekly basis but still inside the bullish channel. It is imperative for bulls to defend 4580.

Black lines - Fibonacci retracement
The lower channel boundary provides the first level of support at 4580. Failure to stay above this level, could lead to a sharp decline towards the Autumn lows near 4300. If a major top is in the making, then our most probable pull back should be towards 3800.

Blue lines -bullish channel
Black lines -Fibonacci retracements
SPX is still in bullish trend but the weekly RSI is warning bulls that the momentum is weakening. The 38% Fibonacci retracement of the entire rise from the Covid-19 lows in 2020 is at 3800 and it is a target justified and should not be ruled out. For now there is no top confirmation, but bulls need to be very cautious as a corrective pull back is more than justified. It would also be healthy for the market in order to pick up momentum for another bullish run.
 English
 Русский
 Bahasa Indonesia
 Bahasa Malay
 ไทย
ไทย Español
 Deutsch
 Български
 Français
 Tiếng Việt
 中文
中文 বাংলা
বাংলা हिन्दी
 Čeština
 Українська
 Română

