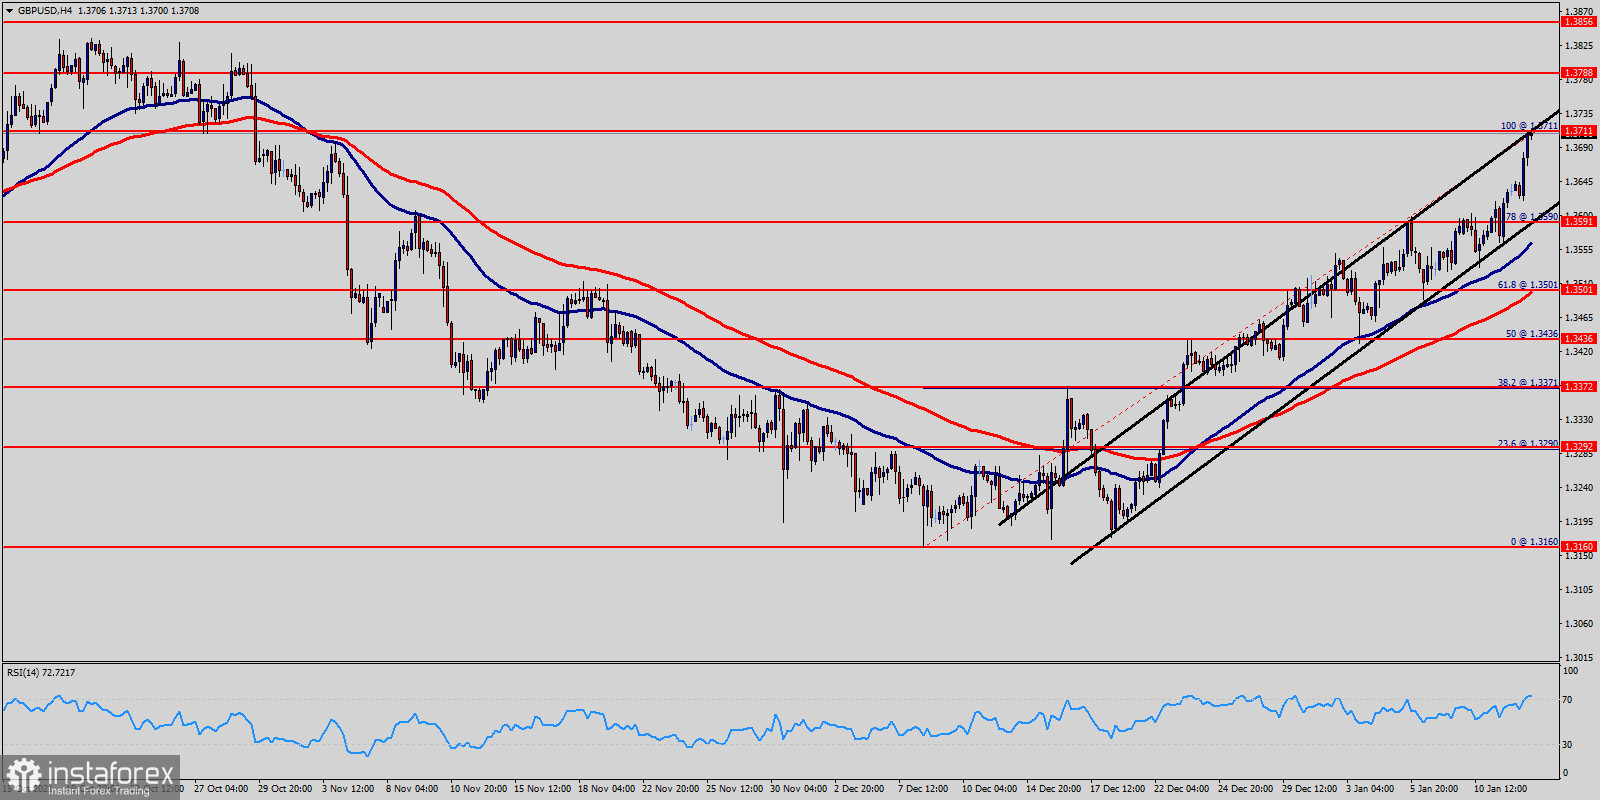
GBPUSD :
Price is testing major resistance at 1.3711. RSI (14) sees a bullish exit of our descending resistance-turned-support line signalling that we'll likely be seeing some bearish momentum from the level of 1.3590.
Price is testing major resistance at 1.3711 (Fibonacci retracement, bearish bar harmonic formation) and we expect to see a strong reaction off this level to push price down towards 1.3711 before 1.3591 support (78% - Fibonacci retracement, horizontal swing low support).
We expect to see a strong reaction off this level to push price down towards 1.3501 (61.8% Fibonacci retracement, horizontal swing low support). The pair is trading below its pivot point. It is likely to trade in a lower range as long as it remains below the pivot point.
Short positions are recommended belwo the area of 1.3788-1.3711 with the first target at 1.3590.
A break of that target will move the pair further downwards to 1.3590. The bias remains bearish in nearest term testing 1.3501 – 1.3436.
Immediate resistance is seen around 1.3711. Briefly, if the pair fails to pass through the level of 1.3711, the market will indicate a bearish opportunity below the strong resistance level of 1.3788.
In this regard, sell deals are recommended lower than the 1.3788 or/znd 1.3711 level with the first target at 1.3591.
It is possible that the pair will turn downwards continuing the development of the bearish trend to the level 1.3501.
However, stop loss has always been in consideration thus it will be useful to set it above the last double top at the level of 1.3711 (notice that the major resistance today has set at 1.3788).
 English
 Русский
 Bahasa Indonesia
 Bahasa Malay
 ไทย
ไทย Español
 Deutsch
 Български
 Français
 Tiếng Việt
 中文
中文 বাংলা
বাংলা हिन्दी
 Čeština
 Українська
 Română

