To open long positions on EUR/USD, you need:
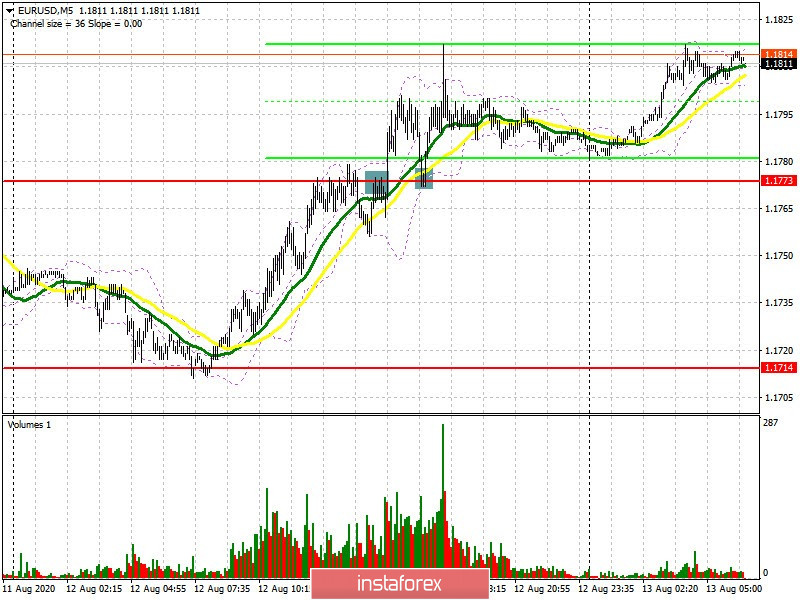
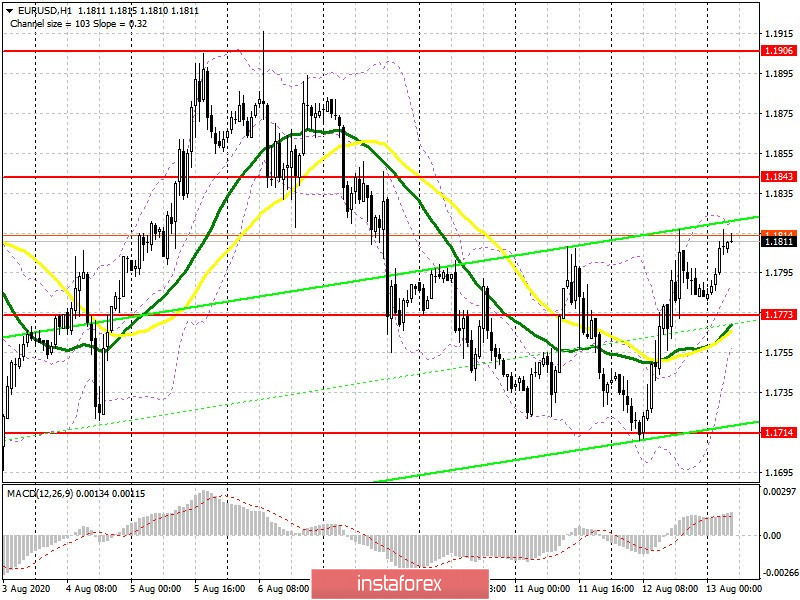
I paid attention to the 1.1773 level yesterday, which the pair gradually approached in the first half of the day. If you look at the 5-minute chart, you will see that a signal to sell the euro was generated after a false breakout formed at this level. However, it failed to materialize even despite good US inflation data, which caused another breakout of this range as well as the euro's recovery in the US session. Then, the pair's repeated decline and an update of the 1.1773 level from top to bottom caused a buy signal to form, which brought more than 50 points profit. At the moment, the bulls are focused on the resistance of 1.1843, where it will be possible to observe the first profit taking on long positions, and this will most likely happen after the release of inflation data in Germany. If we trade and consolidate in this range, you can continue to open long positions in anticipation of updating the high of 1.1906, which is still what buyers are aiming for at the end of this week. A more optimal scenario for buying the euro is a downward correction of the pair to the support area of 1.1773 as well as forming the next false breakout there, along with a rebound from the moving averages. If bulls are not active at this level, I recommend postponing purchases for a rebound from the low of 1.1714 in anticipation of a correction of 30-40 points within the day.
Let me remind you that the Commitment of Traders (COT) reports for August 4 recorded an increase in long positions and a reduction in short ones, which tells us that investors are still interested in risky assets, even at such high prices. Many are betting on a further weakening of the US dollar before the US election and a more difficult situation with the spread of the coronavirus epidemic. The report shows an increase in long non-commercial positions from the level of 242,127 to the level of 262,109, while short non-profit positions decreased from 84,568 to 81,461. As a result, the positive non-commercial net position sharply jumped to 180,648, up from 157,559 a week earlier, indicating increased interest in buying risky assets even at current high prices.

To open short positions on EUR/USD, you need:
Sellers will not rush to return to the market and will most likely wait for the release of the German inflation report. A good indicator will only increase the demand for the euro, so forming a false breakout in the resistance area of 1.1843 will be a signal to open short positions, by analogy, as it was yesterday with the 1.1773 level. The signal was good, but fortune was not on the side of the bears. If there is no activity and a downward movement from the resistance of 1.1843, it is best to postpone short positions for a rebound from a larger weekly high in the area of 1.1906 in anticipation of a correction of 30-40 points within the day. An equally important task for the bears is to pull down and consolidate under the support of 1.1773, where the moving averages currently are kept, since only such a scenario will return pressure on the euro and lead to a repeated return to the area of the low of 1.1714, where I recommend taking profits.

Indicator signals:
Moving averages
Trading is conducted above 30 and 50 moving averages, which indicates an attempt by buyers to return the market under their control.
Note: The period and prices of moving averages are considered by the author on the H1 hourly chart and differs from the general definition of the classic daily moving averages on the daily D1 chart.
Bollinger Bands
A breakout of the upper border of the indicator around 1.1815 will lead to a new wave of euro growth. A breakout of the lower border of the indicator in the area of 1.1773 will increase pressure on the euro.
Description of indicators
- Moving average (moving average, determines the current trend by smoothing out volatility and noise). Period 50. It is marked in yellow on the chart.
- Moving average (moving average, determines the current trend by smoothing out volatility and noise). Period 30. It is marked in green on the chart.
- MACD indicator (Moving Average Convergence/Divergence — convergence/divergence of moving averages) Fast EMA period 12. Slow EMA period to 26. SMA period 9
- Bollinger Bands (Bollinger Bands). Period 20
- Non-commercial traders are speculators, such as individual traders, hedge funds, and large institutions that use the futures market for speculative purposes and meet certain requirements.
- Long non-commercial positions represent the total long open position of non-commercial traders.
- Short non-commercial positions represent the total short open position of non-commercial traders.
- The total non-commercial net position is the difference between short and long positions of non-commercial traders.
 English
 Русский
 Bahasa Indonesia
 Bahasa Malay
 ไทย
ไทย Español
 Deutsch
 Български
 Français
 Tiếng Việt
 中文
中文 বাংলা
বাংলা हिन्दी
 Čeština
 Українська
 Română

