Forecast for August 12:
Analytical overview of currency pairs on the H1 scale:
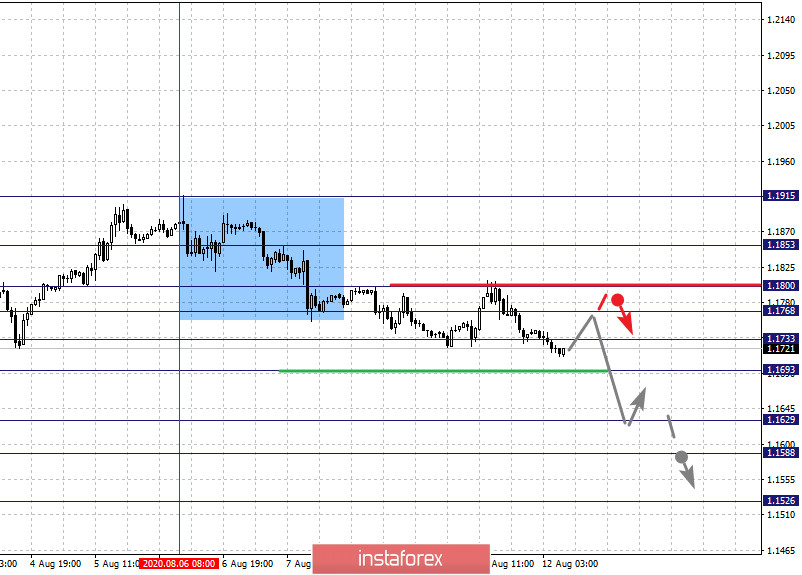
The key levels for the euro / dollar pair on the H1 scale are: 1.1915, 1.1853, 1.1800, 1.1768, 1.1733, 1.1693, 1.1629, 1.1588 and 1.1526. Here, the price is forming a potential for the downward movement from August 6th. A consolidated movement is expected in the range of 1.1733 - 1.1693. The breakdown of the last value should be accompanied by a pronounced downward movement. In this case, the target is 1.1629. Price consolidation is in the range of 1.1629 - 1.1588. For the potential value for the bottom, we consider the level of 1.1526. Upon reaching which, we expect an upward pullback.
A short-term upward movement is possible in the range of 1.1768 - 1.1800. The breakdown of the last value will lead to a deep correction. Here, the target is 1.1853. This is the key support level for the downward structure from August 6.
The main trend is the descending structure from August 6
Trading recommendations:
Buy: 1.1768 Take profit: 1.1800
Buy: 1.1804 Take profit: 1.1850
Sell: 1.1733 Take profit: 1.1700
Sell: 1.1690 Take profit: 1.1630
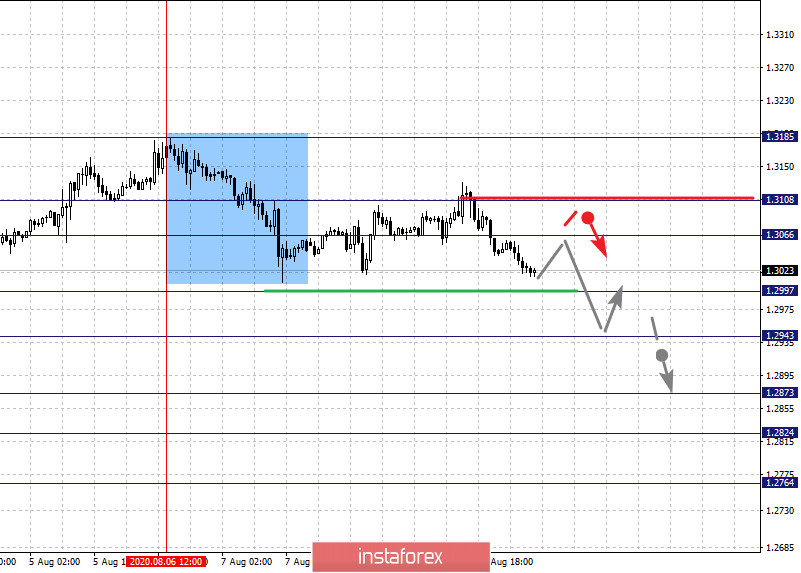
The key levels for the pound / dollar pair on the H1 scale are: 1.3185, 1.3108, 1.3066, 1.2997, 1.2943, 1.2873, 1.2824 and 1.2764. Here, we are following the formation of the downtrend structure from August 6th. A short-term downward movement is expected in the range of 1.2997 - 1.2943. The breakdown of the last level should be accompanied by a pronounced downward movement. Here, the target is 1.2873. There is a short-term downward movement and consolidation in the range of 1.2873 - 1.2824. For the potential value for the bottom, we consider the level of 1.2764. Upon reaching which, we expect an upward pullback.
A consolidated movement is possible in the range of 1.3066 - 1.3108. The breakdown of the last value will encourage the formation of an upward structure. In this case, the potential target is 1.3185.
The main trend is the formation of a descending structure from August 6
Trading recommendations:
Buy: 1.3066 Take profit: 1.3106
Buy: 1.3110 Take profit: 1.3185
Sell: 1.2997 Take profit: 1.2945
Sell: 1.2940 Take profit: 1.2873
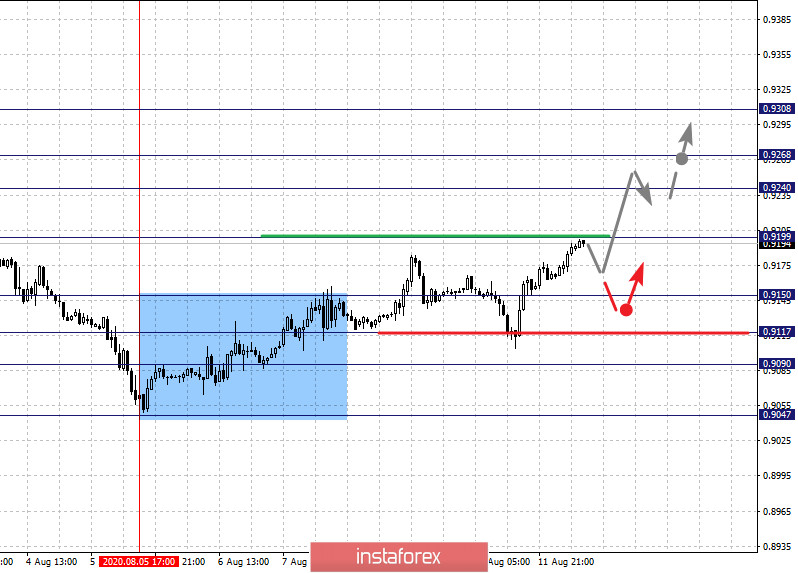
The key levels for the dollar / franc pair on the H1 scale are: 0.9308, 0.9268, 0.9240, 0.9199, 0.9150, 0.9117, 0.9090 and 0.9047. Here, we are following the bullish structure on August 5. The continuation of the upward movement is expected after the breakdown of the level of 0.9200. In this case, the target is 0.9240. There is a short-term upward movement, as well as consolidation in the range of 0.9240 - 0.9268. We consider the level 0.9308 as a potential value for the top. Upon reaching which, we expect consolidation, as well as a downward pullback.
A short-term downward movement is possible in the range of 0.9150 - 0.9117. The breakdown of the last value will lead to a deep correction. Here, the target is 0.9090. This is a key support level for the upward structure.
The main trend is the upward structure from August 5
Trading recommendations:
Buy : 0.9200 Take profit: 0.9240
Buy : 0.9243 Take profit: 0.9265
Sell: 0.9150 Take profit: 0.9120
Sell: 0.9116 Take profit: 0.9090
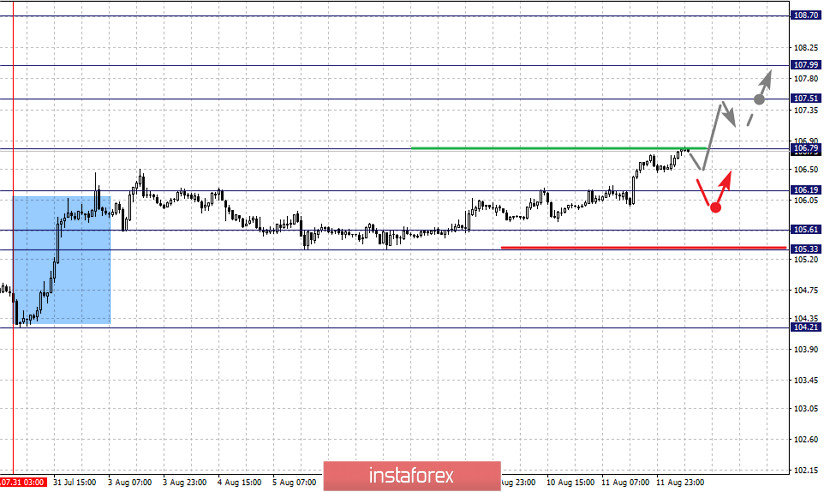
The key levels for the dollar / yen pair on the scale are : 108.70, 107.99, 107.51, 106.79, 106.19, 105.61 and 105.33. Here, we are following the upward cycle from July 31. The continuation of the upward movement is expected after the breakdown of the level of 106.80. In this case, the target is 107.51. Price consolidation is in the range of 107.51 - 107.99. For the potential value for the top, we consider the level 108.70. Upon reaching which, we expect consolidation, as well as a downward pullback.
The level of 106.19 is a key support for the top and its breakdown will lead to the development of a correction. In this case, the target is 105.61. The range of 105.61 - 105.33 is the key support.
The main trend is the upward cycle on July 31
Trading recommendations:
Buy: 106.80 Take profit: 107.50
Buy : 107.53 Take profit: 107.95
Sell: 106.19 Take profit: 105.65
Sell: Take profit:
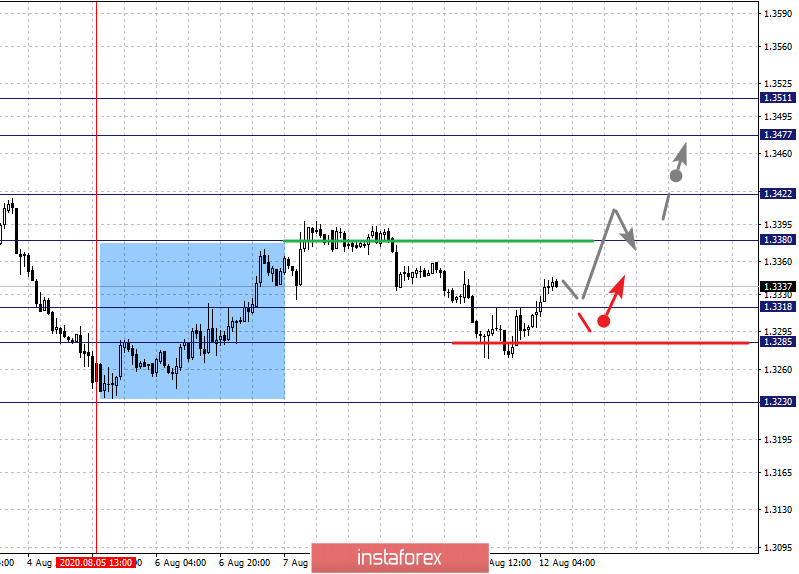
The key levels for the Canadian dollar / US dollar pair on the H1 scale are: 1.3511, 1.3477, 1.3422, 1.3380, 1.3318, 1.3285 and 1.3230. Here, the price forms a potential for the upward movement from August 5th. The continuation of the upward movement is expected after the breakdown of the level of 1.3380. In this case, the target is 1.3422. There is consolidation near this level. The breakdown of the level 1.3424 will lead to a pronounced upward movement. Here, the target is 1.3477. We consider the level of 1.3511 as a potential value for the top. Upon reaching which, we expect consolidation, as well as a downward pullback.
A short-term downward movement is possible in the range of 1.3318 - 1.3285, hence the probability of an upward reversal is high. The breakdown of the level of 1.3285 will encourage the formation of a local downward structure. In this case, the potential target is 1.3230.
The main trend is the upward structure from August 5, the stage of deep correction
Trading recommendations:
Buy: 1.3380 Take profit: 1.3420
Buy : 1.3424 Take profit: 1.3475
Sell: 1.3318 Take profit: 1.3287
Sell: 1.3283 Take profit: 1.3235
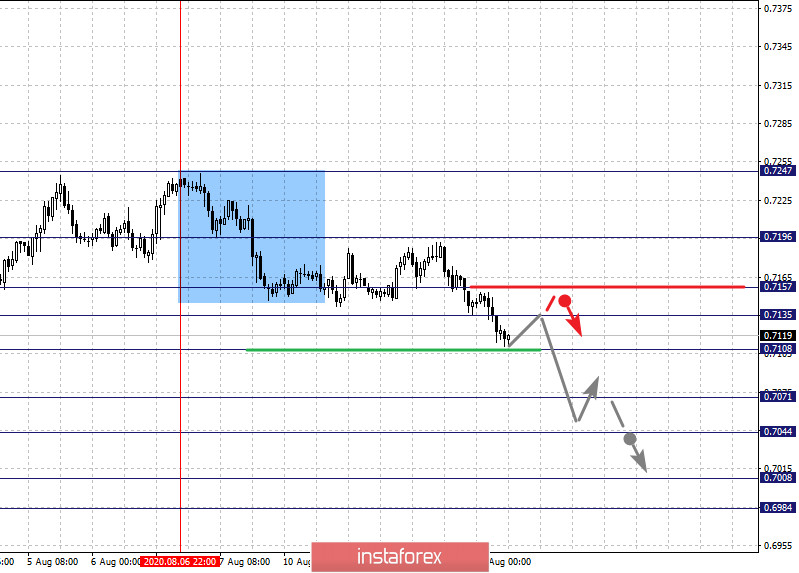
The key levels for the Australian dollar / US dollar pair on the H1 scale are : 0.7247, 0.7196, 0.7157, 0.7135, 0.7108, 0.7071, 0.7044, 0.7008 and 0.6984. Here, we are following the development of the descending structure from August 6th. The continuation of the downward movement is expected after the breakdown of the level of 0.7108. In this case, the target is 0.7071. Price consolidation is in the range of 0.7071 - 0.7044. For the potential value for the bottom, we consider the level of 0.6984. Upon reaching which, we expect a consolidated movement in the range of 0.7008 - 0.6984, as well as an upward pullback.
A short-term upward movement is possible in the range of 0.7135 - 0.7157. The breakdown of the last value will lead to a deep correction. Here, the target is 0.7196. This is the key support level for the downward structure.
The main trend is the descending structure from August 6
Trading recommendations:
Buy: 0.7135 Take profit: 0.7155
Buy: 0.7157 Take profit: 0.7194
Sell : 0.7106 Take profit : 0.7071
Sell: 0.7069 Take profit: 0.7046
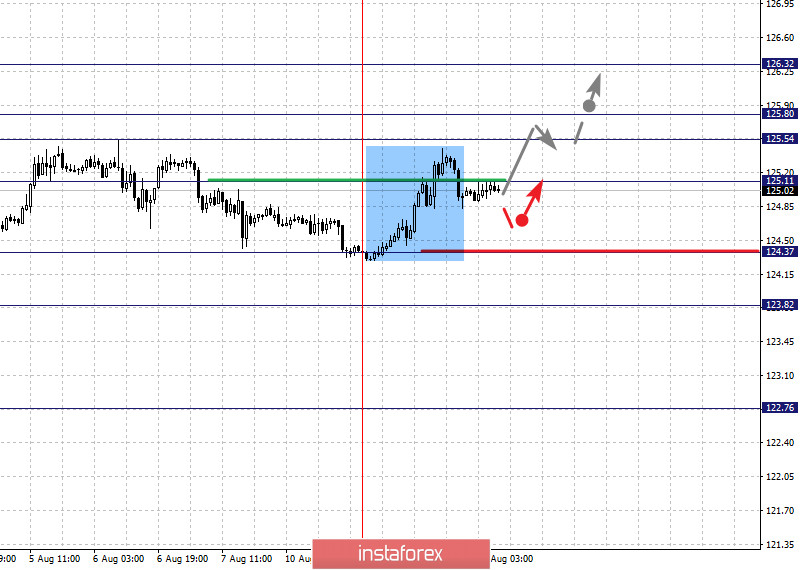
The key levels for the euro / yen pair on the H1 scale are: 126.32, 125.80, 125.54, 125.11, 124.81, 124.37 and 123.82. Here, we are watching the upward structure from July 24. At the moment, the price has formed a local structure for the top of August 10. The continuation of the upward movement is expected after the breakdown of 125.11. In this case, the first target is 125.54. A short-term upward movement is expected in the range 125.54 - 125.80. The breakdown of the last value will lead to a movement to a potential target of 126.32. Upon reaching which, we expect a downward pullback.
The level of 124.37 is a key support for the top and it's breakdown will encourage the formation of a downward structure. Here, the potential target is 123.82. We expect the formation of pronounced initial conditions for a downward cycle before this level.
The main trend is the upward structure from July 24, local structure for the top from August 10
Trading recommendations:
Buy: 125.11 Take profit: 125.50
Buy: 125.55 Take profit: 125.80
Sell: 124.35 Take profit: 123.90
Sell: Take profit:
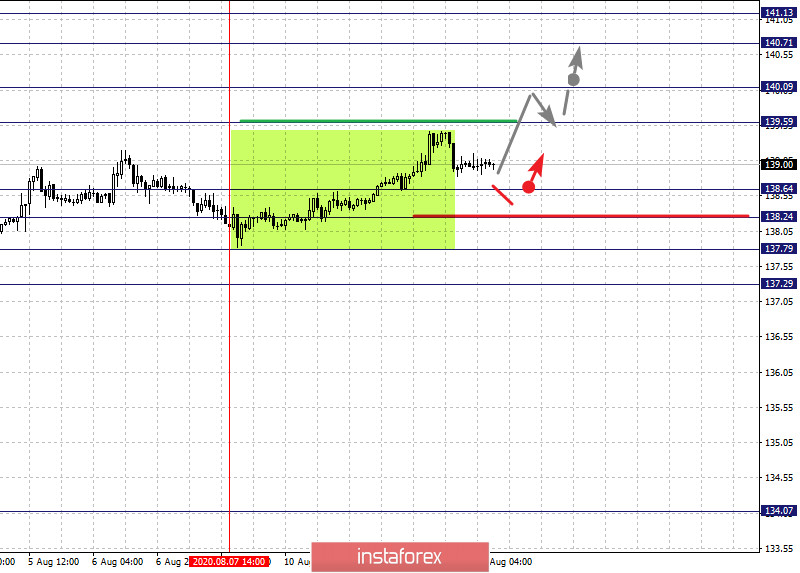
The key levels for the pound / yen pair on the H1 scale are : 141.13, 1407.71, 140.09, 139.59, 138.64, 138.24, 137.79 and 137.29. Here, the subsequent targets for the high have been determined from the local upward structure on August 7. A short-term upward movement is expected in the range 139.59 - 140.09. The breakdown of the last value should be accompanied by a pronounced upward movement. In this case, the target is 140.71. For the potential value for the top, we consider the level 141.13. Upon reaching which, we expect a consolidated movement, as well as a downward pullback.
A short-term downward movement is possible in the range of 138.64 - 138.24. The breakdown of the last value will favor the development of a downward structure. Here, the first target is 137.79. For the potential value for the bottom, we consider the level of 137.29, to which we expect the formation of pronounced initial conditions for a downward cycle.
The main trend is the local structure for the top from August 7
Trading recommendations:
Buy: 139.60 Take profit: 140.05
Buy: 140.10 Take profit: 140.70
Sell: 138.64 Take profit: 138.26
Sell: 138.32 Take profit: 137.80
 English
 Русский
 Bahasa Indonesia
 Bahasa Malay
 ไทย
ไทย Español
 Deutsch
 Български
 Français
 Tiếng Việt
 中文
中文 বাংলা
বাংলা हिन्दी
 Čeština
 Українська
 Română

