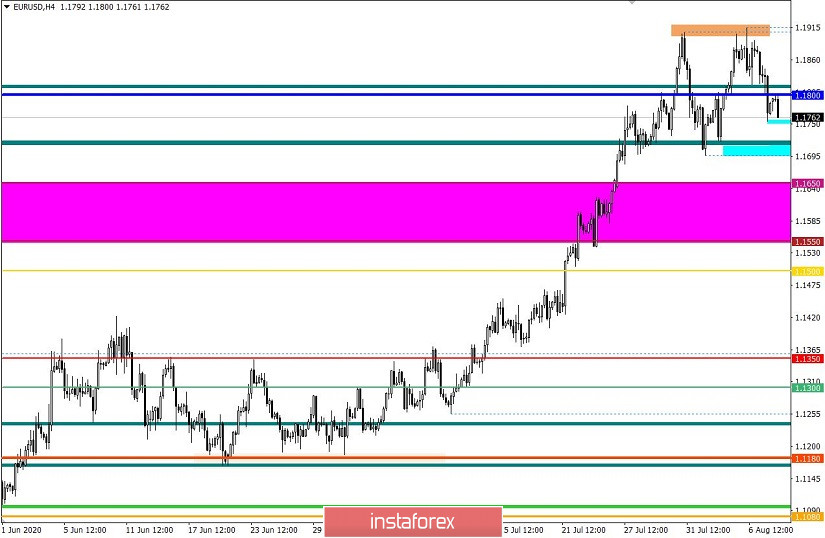
The EUR/USD currency pair has found a resistance point in the 1.1900/1.1920 area once again, where a slowdown occurred on a natural basis and as a result of the outlines of a correction, which returned us below the level of 1.1800.
The dynamics of fluctuations is very similar to July 31, where a similar spill of the European currency rate took place, the similarity is so great that even the activity of speculators coincides in terms of daily volatility.
The characteristic amplitude of the past two weeks 1.1700/1.1920 tries to change the structure of the inertial movement, but, as we can see, this is not such an easy task, even though the euro rate has a consistently high overbought level.
When to expect dramatic changes in the value of the European currency?
This question worries all traders without exception, if we proceed from the high rate of the euro and the prospect of weakening relative to the scale of inertia, then the best signal for action would be to consolidate the price below 1.1700. In this case, we would see not just a correction, but a full-fledged recovery of dollar positions, which have recently been under a flurry of sales.
At the same time, traders began to actively consider the situation with an amplitude of 1.1700/1.1920 as a theoretically possible platform for regrouping trading forces, in case the plan to restore dollar positions in the direction of 1.1500/1.1550 fails.
Analyzing the Friday trading day by the minute, we can see that the main surge in short positions occurred during the start of the American session, which coincides with the publication of the report of the United States Department of Labor.
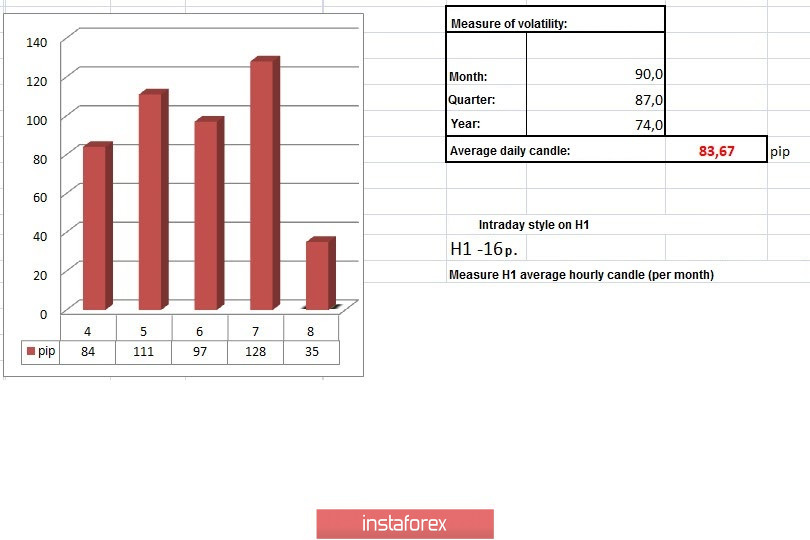
In terms of daily volatility, the highest indicator of dynamics for 6 trading days is recorded, it amounted to 139 points, which is 25% higher than the average daily level, 111 ---> 139p.
Acceleration of activity was an expected phenomenon, which was already written in the previous review, based on the pattern of a strong news background, as well as a sharp decline in volatility the day before, which was not a typical phenomenon with such a high speculative activity.
As discussed in the previous review, traders were ready for short positions and the increase in volumes occurred just after passing the level of 1.1800, where our orders were.
Considering the trading chart in general terms (daily period), it can be seen that all recent price fluctuations are minor changes in the structure of inertia from July 1. The scale-justified correction is in the area of 1.1500/1.1650.

The news background on Friday included the report of the United States Department of Labor, where the unemployment rate for July fell to 10.2%, from 11.1% in June, which was a catalyst for the growth of the US dollar. In turn, the number of jobs increased in July by 1,763,000 against the expectation of 1,620,000. Naturally, all these indicators are extremely weak, and even terrible when compared with 2019, but look at the monthly intervals since the collapse of the labor market this spring, then we have at least some, but still recovery.
Unemployment rate:
April 14.7%
May - 13.3%
June - 11.1%
Today, in terms of the economic calendar, we have JOLTS data on the number of job openings in the US labor market for June, where it is forecast to decline from 5,397,000 to 4,900,000.
Further development
Analyzing the current trading chart, the price rebound from the value of 1.1800 can be seen, where the quote pulled back during the Asian session. Updating Friday's low (1.1755) may well start the process of building up short positions, which will lead to the price movement towards the values of 1.1700-1.1720. For primary changes, the quote must be consolidated below 1.1700, on a four-hour period, otherwise a repetition of the amplitude 1.1700 ---> 1.1800 ---> 1.1900 cannot be ruled out.

Indicator analysis
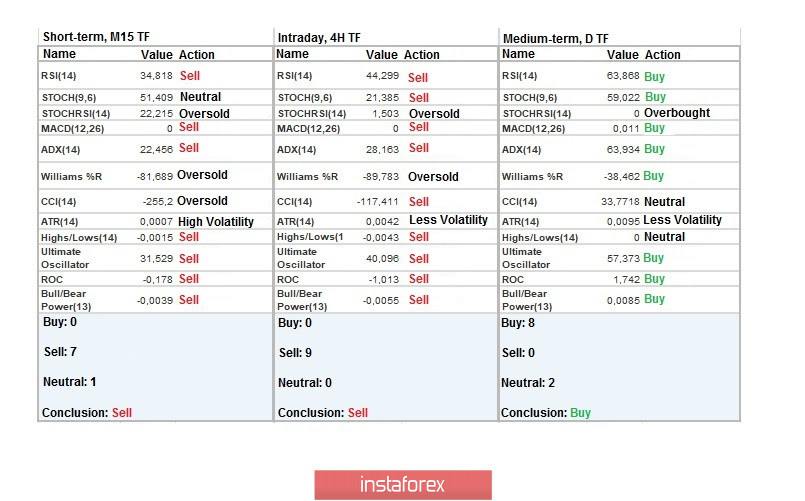
Analyzing different sectors of time frames (TF), we see that the indicators of technical instruments on the minute and hourly periods signal a sale due to a downward movement from the area of 1.1900/1.1920 and a price rebound from 1.1800. The daily period, as before, signals a buy, focusing on the inertial upward trend.

Weekly volatility / Volatility measurement: Month; Quarter; Year
Measurement of volatility reflects the average daily fluctuation, calculated per Month / Quarter / Year.
(August 10 was built taking into account the publication time of the article)
The volatility of the current time is 35 points, which is 57% below the daily average. There is a high probability that activity will accelerate if the Friday low is updated.

Key levels
Resistance zones: 1.1800 **; 1.1900 *; 1.2000 ***; 1.2100 *; 1.2450 **.
Support zones: 1.1650 *; 1.1500; 1.1350; 1.1250 *; 1.1.180 **; 1.1080; 1.1000 ***; 1.0850 **; 1.0775 *; 1.0650 (1.0636); 1.0500 ***; 1.0350 **; 1.0000 ***.
* Periodic level
** Range level
*** Psychological level
 English
 Русский
 Bahasa Indonesia
 Bahasa Malay
 ไทย
ไทย Español
 Deutsch
 Български
 Français
 Tiếng Việt
 中文
中文 বাংলা
বাংলা हिन्दी
 Čeština
 Українська
 Română

