GBP/USD
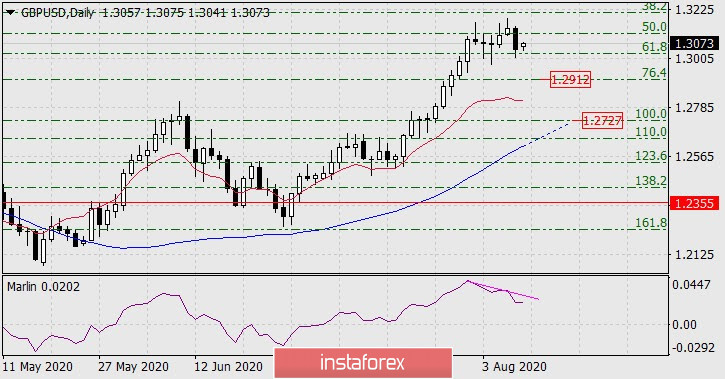
The pound sterling, supported by the US dollar's appreciation, continued to work with reversal technical patterns last Friday. These are price divergences with the Marlin oscillator on the daily and four-hour charts.

The pound fell 90 points on Friday, marking the 61.8% Fibonacci level with the lower shadow. Now we are waiting for the price to overcome the Friday low and decline further towards the Fibonacci level of 76.4% at 1.2912. In the future, we are waiting for a movement to the Fibonacci level of 100.0%, towards the MACD line (1.2727).

The price has already consolidated below the balance (red indicator) and MACD (blue) lines on the four-hour chart. Marlin is in the negative trend zone. The trend is completely downward on this chart, you should wait for the price to break through the Friday low, which will be a signal to move to the first target of 1.2912.
 English
 Русский
 Bahasa Indonesia
 Bahasa Malay
 ไทย
ไทย Español
 Deutsch
 Български
 Français
 Tiếng Việt
 中文
中文 বাংলা
বাংলা हिन्दी
 Čeština
 Українська
 Română

