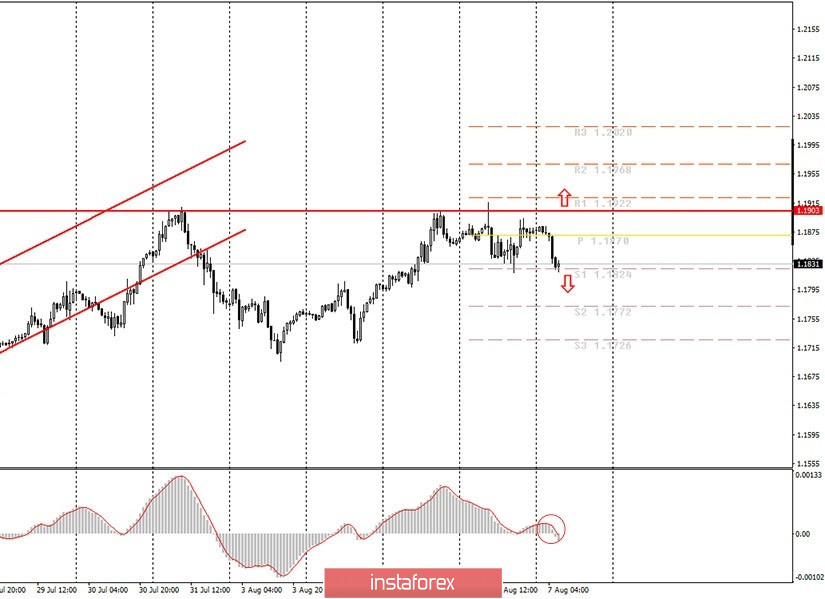
Hourly chart of the EUR/USD pair

Since the last article was written (the evening of August 6), the EUR/USD pair managed to slightly correct upward, and resume the downward movement at the signal of the MACD indicator, and reach the first target for Friday, August 7 (support and resistance levels are updated every day). Thus, at the moment, the quotes of the pair have already reached the previous local low - 1.1818, and now the question is open, will traders be able to break through it and continue moving down? We have already mentioned in previous reviews that sellers are now extremely weak and do not have enough desire to start another long downward hike. Although most of the technical and fundamental factors favor them. The difficult epidemiological and economic situation in America continues to deter traders from making serious purchases of the US dollar.
The Nonfarm Payrolls report will be released on August 7, in the afternoon, which is extremely important for the prospects of the US dollar. This is the name of the indicator that reflects the number of new jobs created in the country, excluding the agricultural sector. This indicator is considered to have the same degree of importance as GDP and inflation. That is, the market reaction to it can be very strong. But what will it be like today? Recall that the dollar is growing very reluctantly now (falling EUR/USD = rising US dollar). Thus, the Nonfarm Payrolls indicator should impress traders to rush to buy the US currency. The forecast for this report is +1.6 million jobs in July, which is actually quite a bit. Let us remind novice traders that in March and April, the number of these same jobs in the United States fell by 22 million. This was followed by a recovery in May and June by 2.7 and 4.8 million respectively. Thus, if we see +1.6 million today, it would mean that the labor market recovery is slowing and traders are unlikely to be impressed by this. In order for the US dollar to go into growth (based precisely on this report), it is necessary that the forecast be surpassed by at least 200-300,000 or better - at least 2 million. Reports on unemployment and wages are also important, but will be overshadowed by Nonfarm Payrolls. We also remind novice traders that corrections often occur on Fridays (movement against the main trend, now an upward trend), which are caused by traders closing positions according to the trend before the weekend, which leads to a downward pullback.
The following scenarios are possible on August 7:
1) Purchases are not relevant yet, as the price left the ascending channel and could not overcome the 1.1903 level. However, given the fact that the downward trend has not yet begun, it is possible that the upward trend will eventually resume. Therefore, for novice traders, we still recommend buying the euro if the price closes above the 1.1903 line at the end of the next hour , which passes through the last three price highs. In this case, targets are the resistance levels of 1.1968 and 1.2020. Although you are advised to take profit near the first target.
2) Selling the currency pair is still more promising now. The price managed to drop to the support level of 1.1824 at night and now sellers need to close the price below it at the end of the next hour. If this happens, the downward movement will continue with targets at the support levels of 1.1772 and 1.1726. But a price rebound from 1.1824 or an upward reversal of the MACD will indicate the resumption of the upward movement on Friday morning. And then it will be necessary to wait for the Nonfarm Payrolls report in the hope that it beats forecasts.
What's on the chart:
Support and Resistance Price Levels - Levels that are targets when buying or selling. You can place Take Profit levels near them.
Red lines - channels or trend lines that display the current trend and show which direction it is preferable to trade now.
Arrows up/down - indicate when you reach or overcome which obstacles you should trade up or down.
MACD indicator is a histogram and a signal line, the crossing of which is a signal to enter the market. It is recommended to use in combination with trend lines (channels, trend lines).
Important speeches and reports (always contained in the news calendar) can greatly influence the movement of a currency pair. Therefore, during their exit, it is recommended to trade as carefully as possible or exit the market in order to avoid a sharp price reversal against the previous movement.
Beginners in the forex market should remember that every trade cannot be profitable. The development of a clear strategy and money management are the key to success in trading over a long period of time.
 English
 Русский
 Bahasa Indonesia
 Bahasa Malay
 ไทย
ไทย Español
 Deutsch
 Български
 Français
 Tiếng Việt
 中文
中文 বাংলা
বাংলা हिन्दी
 Čeština
 Українська
 Română

