To open long positions on EUR/USD, you need:
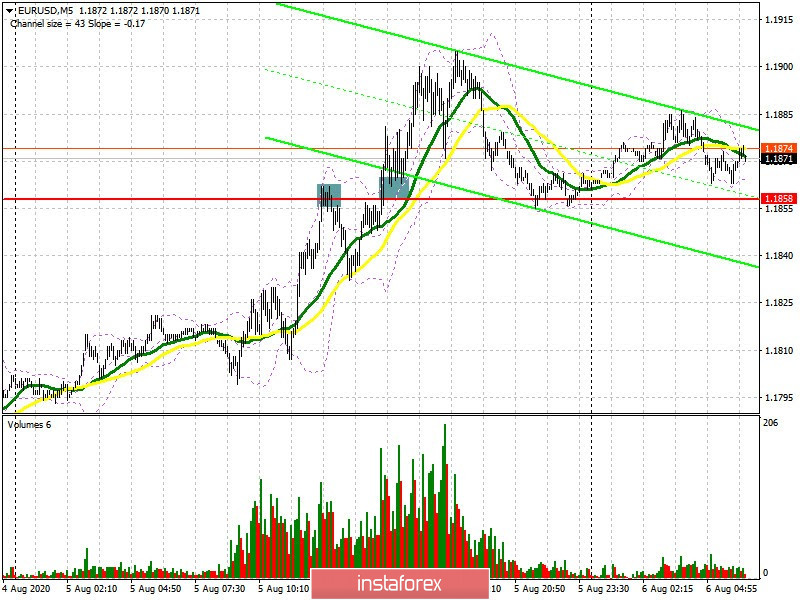
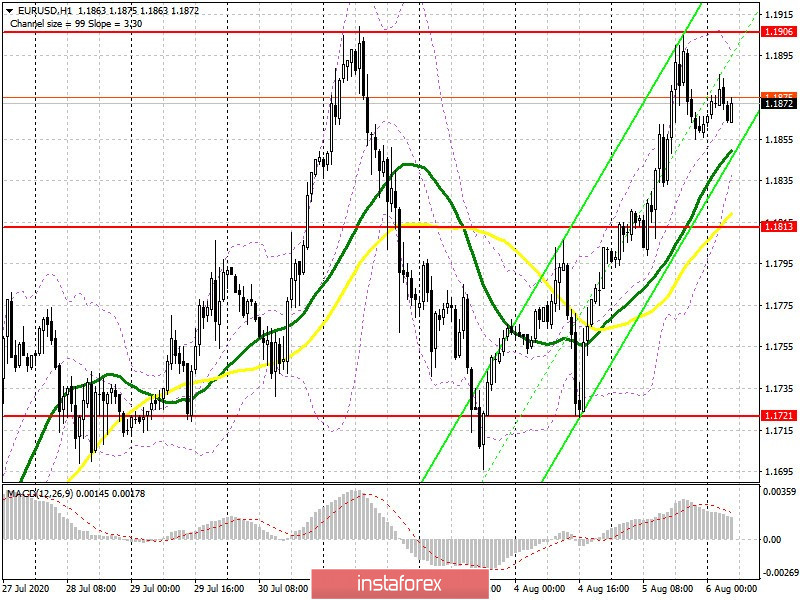
After the bears tried to return the market to their side, and we are talking about short positions from 1.1858 (I analyzed it in detail in yesterday's review), the bulls managed to break this range, which formed a new signal to buy the euro. If you look at the 5-minute chart, you will see how the breakout and consolidation above the 1.1858 level formed a good entry point into long positions, after which the pair flew up another 50 points. However, we did not reach the cherished goal of 1.1930. At the moment, the technical picture has changed. The resistance of 1.1906 returned to the market, which will determine the further direction of the pair. Important reports on the European economy are not expected in the first half of the day, so the bulls' main task is to break through and consolidate above this range, since it will be possible to open long positions in this case, in anticipation of continuing the bullish trend to the highs of 1.1987 and 1.2020, where I recommend taking profits. The 1.2054 area will be a more distant target. However, the optimal scenario is to buy EUR/USD after a downward correction to the support area of 1.1813, where you can open long positions immediately for a rebound in the expectation of an upward movement of 30-40 points. If bulls are not active at this level, the next major support will be the low of 1.1721, which is also the lower limit of the current wide side channel.
Let me remind you that a sharp increase in long positions and only a small increase in short ones were recorded in the Commitment of Traders (COT) reports for July 28, which tells us about the continued interest of investors in risky assets amid confusion that is happening in the US due to the coronavirus and the presidential election. The report shows an increase in long non-commercial positions from 204,185 to 242,127, while short non-commercial positions have grown only from 79,138 to 84,568. As a result, the positive non-commercial net position jumped sharply to 157,559, up from 125,047 a week earlier, indicating increased interest in buying risky assets even at current high prices.

To open short positions on EUR/USD, you need:
Sellers are not in a hurry to return to the market yet, and even yesterday's excellent ISM data for the non-manufacturing sector of the US did not cause the dollar to strengthen, but on the contrary fueled the interest of euro bulls. All the bears can count on a false breakout forming in the resistance area of 1.1906 and a divergence on the MACD indicator in the morning. This scenario forms an entry point into short positions with the goal of going down to the middle of the channel of 1.1813, where I recommend taking profits. The long-term goal will be the low of 1.1721. If the demand for the euro persists, and everything is still going to this, and the data on the US labor market will not be as bad as expected, then I recommend returning to short positions only after updating the high of 1.1987, or immediately on a rebound from the resistance of 1.2020 based on a correction of 30-40 points within the day.

Indicator signals:
Moving averages
Trading is carried out slightly above 30 and 50 moving averages, which indicates the euro's growth along the trend.
Note: The period and prices of moving averages are considered by the author on the H1 hourly chart and differs from the general definition of the classic daily moving averages on the D1 daily chart.
Bollinger Bands
A breakout of the upper border of the indicator around 1.1906 will lead to a new wave of euro growth. A breakout of the lower border of the indicator in the 1.1850 area will increase pressure on the euro.
Description of indicators
- Moving average (moving average, determines the current trend by smoothing out volatility and noise). Period 50. It is marked in yellow on the chart.
- Moving average (moving average, determines the current trend by smoothing out volatility and noise). Period 30. It is marked in green on the chart.
- MACD indicator (Moving Average Convergence/Divergence — convergence/divergence of moving averages) Fast EMA period 12. Slow EMA period to 26. SMA period 9
- Bollinger Bands (Bollinger Bands). Period 20
- Non-commercial traders are speculators, such as individual traders, hedge funds, and large institutions that use the futures market for speculative purposes and meet certain requirements.
- Long non-commercial positions represent the total long open position of non-commercial traders.
- Short non-commercial positions represent the total short open position of non-commercial traders.
- The total non-commercial net position is the difference between short and long positions of non-commercial traders.
 English
 Русский
 Bahasa Indonesia
 Bahasa Malay
 ไทย
ไทย Español
 Deutsch
 Български
 Français
 Tiếng Việt
 中文
中文 বাংলা
বাংলা हिन्दी
 Čeština
 Українська
 Română

