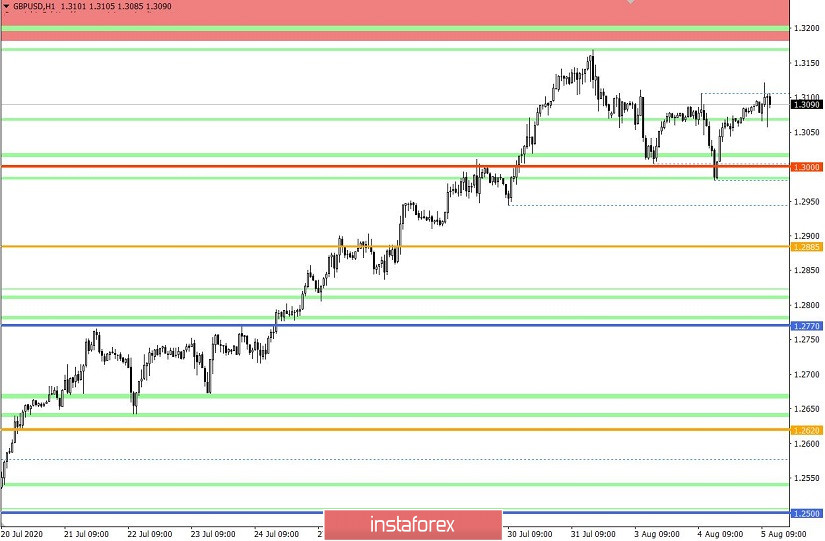
The GBP / USD pair, moving along the trajectory of a pullback from the high of 1.3169, found a foothold at the level of 1.3000, where a slowdown occurred, after which the quote rebounded in price.
The strong upward movement led to a change in price from 1.2150 // 1.2350 // 1.2620 to 1.2770 // 1.3000 // 1.3300, but now the quote is trying to maintain the bullish mood in order to reach the upper limit of the 1.3000 / 1.3300 channel.
Hence, the pound is currently overbought, which is rather difficult to hide as everyone is well aware of the fact that the US dollar is currently weak in the market, and demand for risk assets, including the pound, is at a high level.
The dollar has been in sales since early July, and so far it has not been possible to change the situation since demand for it is weak due to a number of factors. As a result, most of the dollar pairs have been rising in the forex market, that is, the EUR / USD pair is overbought and is trading vertically in the charts.
Thus, if we analyze the trading yesterday in more detail, we will see a high level of speculation, due to which a V-shaped pattern was formed. The first round of activity came to the market during the European session, where the quote managed to go down to a price level of 1.3000. Meanwhile in the US session, nothing changed in terms of speculation, but the flow of long positions returned the quote to the level of the daily candle.
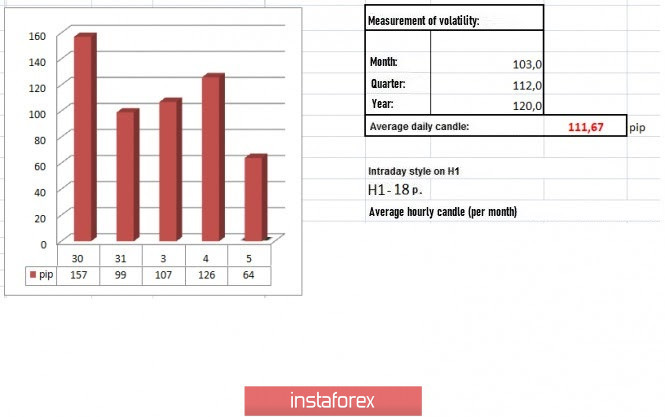
Such high activity resulted in a volatility of 126 points, which is 13% above the average daily value. This means that the speculative mood, day after day, proves its superiority in the market.
Meanwhile, as discussed in the previous review , traders were ready for a price jump to the level of 1.3000, which is why sell orders were placed below the level of 1.3050.
Hence, in the daily chart, the structure of the candlesticks indicates a high degree of uncertainty, where at first a sell signal was received in the form of the "Shooting Star", after which two consecutive "Doji" candles were formed, which may mean an upcoming speculative jump in the market.
As for news, the reports published yesterday included data on industrial orders in the United States, where in June they recorded an increase of 6.2%, but, as we can see from the trading schedule, the market did not react and was, at that moment, on a wave of speculation.
An update on trade negotiations between the UK and the EU also came out, in which EU's chief negotiator Michel Barnier said that the European Union is quite ready to compromise with regards to control on tax benefits for British companies.
At the same time, the UK also sees that the parties will succeed in reaching an agreement by the October 31 deadline.
The four main blocks of disagreement that have stalled the negotiations include issues such as legally binding general rules on competition and business regulation, refusal to accept obligations to implement the European Convention on Human Rights, refusal from information on different branches of cooperation in one association agreement , and issues on fishing.

Today, data on business activity in the UK was published, the index for which grew from 47.1 to 56.5. Meanwhile, composite PMI for July rose from 47.1 to 57.0.
Such figures increased demand for the pound in the market.
In the afternoon, ADP will publish its July US Employment Report, which predicts an increase in labor indicators of about 1,550,000, but such is still not enough for a recovery in employment.
Further development
Analyzing the current trading chart, we can see a local surge in activity during the start of the European session, where the quote managed to consolidate in the range 1.3080 / 1.3115, which reflects the upper boundary of the current week's fluctuations.
To change the cycle of fluctuations, the quote must consolidate above 1.3125, as such will push the pair in the area of high at the level of 1.3169. It can start the process of a set of trading volumes, which will lead to a further upward movement towards 1.3200-1.3250.
But, an alternative scenario could develop, if the US dollar remains oversold, as such will maintain the quote trading along the range 1.3000 / 1.3115.

Indicator analysis
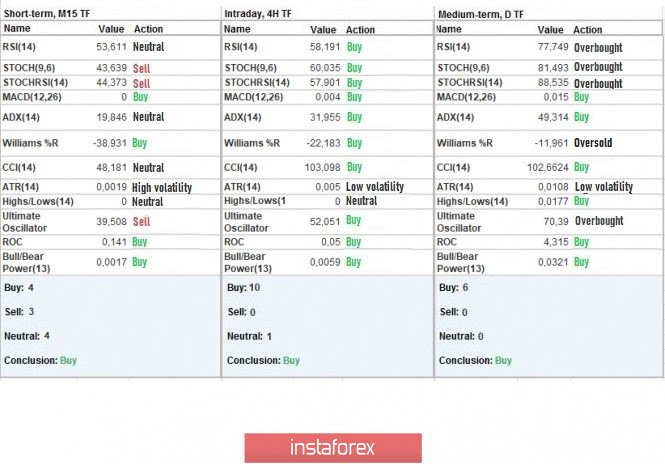
Analyzing the different sectors of timeframes (TF), we can see that the indicators of technical instruments on the minute and hourly periods signal "buy" due to a consolidation the area of 1.3080 / 1.3115, while the daily period signal "buy" in reflection to the general market mood.

Weekly volatility / Volatility measurement: Month; Quarter; Year
The measurement of volatility reflects the average daily fluctuation, calculated per Month / Quarter / Year.
(August 5 was built, taking into account the time the article is published)
The current volatility is 67 points, which is 42% below the average daily value. Its dynamics depend on the intensity of speculators' operations, so if we refer to news, then there are incentives for activity.

Key levels
Resistance zones: 1.3200 **; 1.3300 **; 1.3600; 1.3850; 1.4000 ***; 1.4350 **.
Support Zones: 1.3000; 1.2885 *; 1.2770 **; 1.2620; 1.2500; 1.2350 **; 1.2250; 1.2150 **; 1.2000 *** (1.1957); 1.1850; 1.1660; 1.1450 (1.1411); 1.1300; 1.1000; 1.0800; 1.0500; 1.0000.
* Periodic level
** Range level
*** Psychological level
Also check the trading recommendation for the EUR/USD pair here, or the brief trading recommendations for EUR / USD here.
 English
 Русский
 Bahasa Indonesia
 Bahasa Malay
 ไทย
ไทย Español
 Deutsch
 Български
 Français
 Tiếng Việt
 中文
中文 বাংলা
বাংলা हिन्दी
 Čeština
 Українська
 Română

