EUR / USD

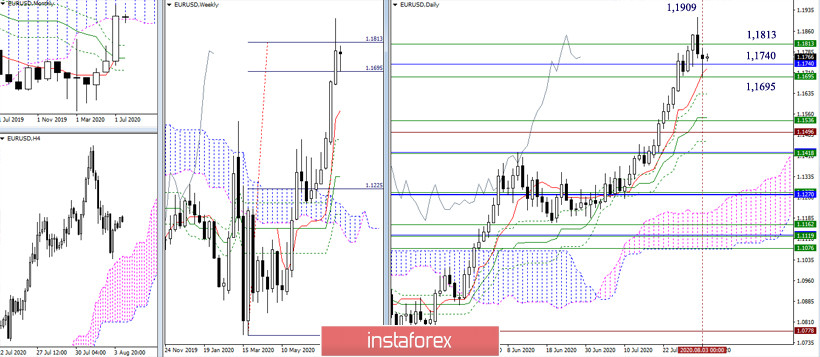
Yesterday, the pair executed a downward correction to the daily short-term trend. Now, the daily Tenkan which is located at 1.1725 today, is joining forces with the passed and tested levels of the weekly target (1.1695 - 1.1813) and the monthly Senkou Span A (1.1740). The accumulation of levels can reflect its influence on the development of the situation. If their attraction turns out to be enough, then consolidation is possible instead of continuing to decline. To deepen the downward correction, you need to securely consolidate below the levels. But to restore the upward trend, it is required to break out of the zone of attraction of the met levels and consolidate above the high of the last month (1.1909).

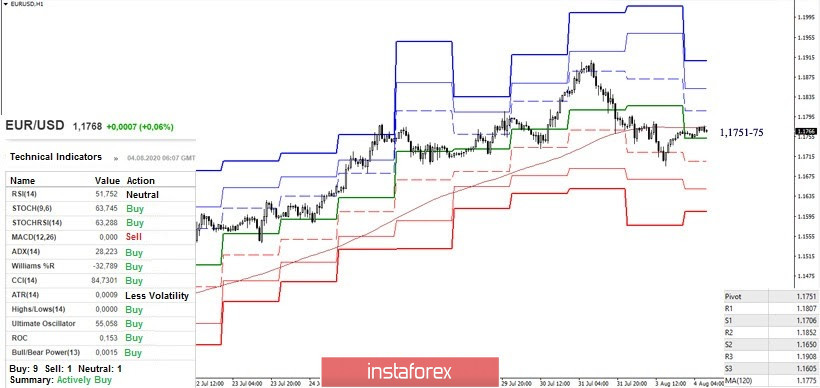
The key levels of the lower halves today are forming a zone of attraction in the region of 1.1751-75 (central Pivot level + weekly long-term trend). Anchoring above these levels on H1 gives preference to the players to increase. In this case, the reference points within the day will be the resistances of the classic Pivot levels 1.1807 - 1.1852 - 1.1908. A consolidation below 1.1751-75 will help strengthen the bearish mood. The downside traders will be able to continue the downward movement after breaking through the supports at 1.1696 - 1.1706 (minimum extremum + S1), strengthened by the weekly level of 1.1695. The next support for the classic Pivot levels is waiting for the pair at 1.1650 and 1.1605.
GBP / USD

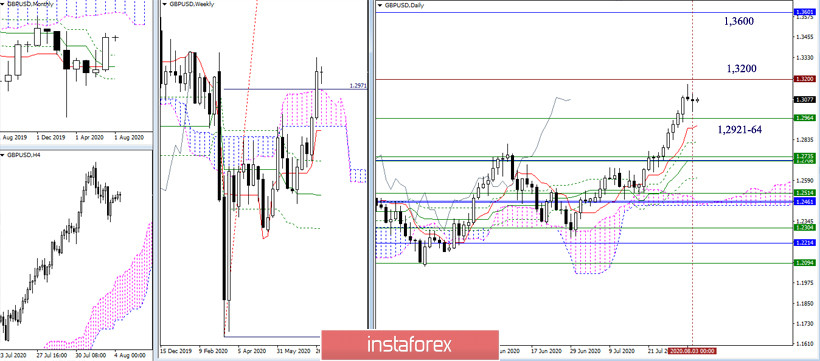
The decline and correctional decline, outlined on Friday, continued at the start of a new week. Nevertheless, there is no significant result yet. The bulls are trying to maintain their positions and stay on the achieved lines. In July, the bulls managed to overcome important resistances and come close to the zone of influence of a significant historical milestone, located at about 1.32. This line has shown itself more than once in history, and is a reliable resistance zone since 2018, which, combining many strong levels from Ichimoku, has held back the development of the situation. Now, apart from historical resistance, there are no other obstacles from Ichimoku in this area. Therefore, if the players on the rise can hold the situation and do not go from the encountered resistance to a deep correction, then after overcoming the 1.32 area, you can count on new achievements and a good potential for an upward movement. In this case, the nearest reference point will be the lower border of the monthly cloud (1.3601). The supports and the first targets of the downward correction can be noted today at 1.2921-64 (monthly Senkou Span A + daily Tenkan).

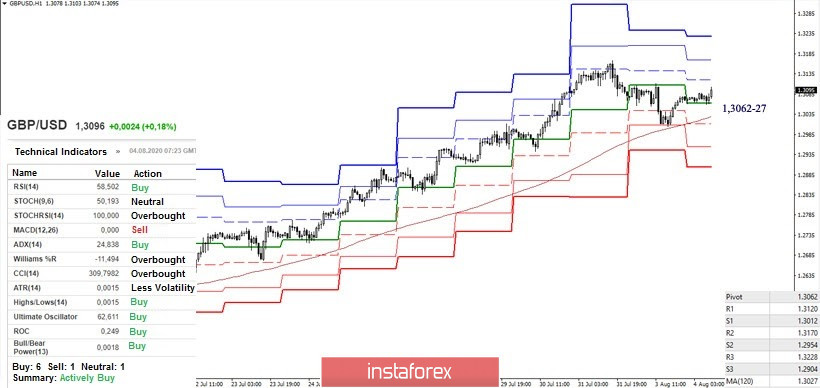
Despite the deep downward correction, the bulls retained the support of the weekly long term trend, and hence their advantage in the lower halves. Today, key levels are forming a support zone around 1.3062-27 (central pivot level + weekly long-term trend). The work above the levels retains the bullish advantages and the relevance of the upward targets of 1.3120 - 1.3170 - 1.3228 (the resistance of the classic Pivot levels). A consolidation below will affect the current balance of power, and after the update of yesterday's low (1.3004), the next downside targets within the day will be the supports S2 (1.2954) and S3 (1.2904).
Ichimoku Kinko Hyo (9.26.52), Pivot Points (Classic), Moving Average (120)
 English
 Русский
 Bahasa Indonesia
 Bahasa Malay
 ไทย
ไทย Español
 Deutsch
 Български
 Français
 Tiếng Việt
 中文
中文 বাংলা
বাংলা हिन्दी
 Čeština
 Українська
 Română

