GBP/USD
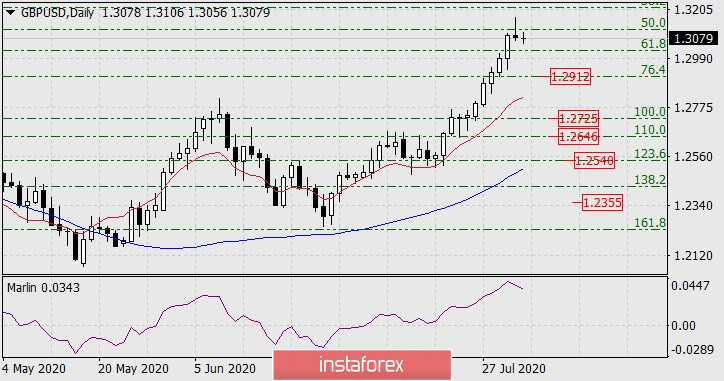
The pound sterling showed the first black candlestick in the last ten sessions on the daily chart last Friday. It is known from practice that this pattern - a black candlestick after the previous ten white ones (and vice versa) - is often a reversal signal - either to a deep correction or to a trend change. The Marlin oscillator showed a reversal from the overbought zone. This is probably the desire to reach the target level of 1.2912, which coincides not only with the Fibonacci level of 76.4%, but also with the low on December 23, 2019.

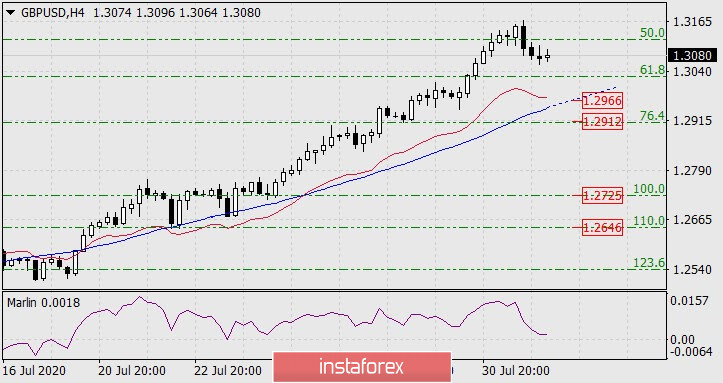
It is noticeable that since the price reached the 1.2912 level on the 4-hour chart, this will result in the price moving under the MACD line, which will become an additional technical factor for a further decline, and the next target at 1.2725 is the 100.0% Fibonacci level, correlating with the February 28 low. We are waiting for confirmation of the British pound reversal. And although the trend is steady upward, it is dangerous to buy.

 English
 Русский
 Bahasa Indonesia
 Bahasa Malay
 ไทย
ไทย Español
 Deutsch
 Български
 Français
 Tiếng Việt
 中文
中文 বাংলা
বাংলা हिन्दी
 Čeština
 Українська
 Română

