EUR/USD
Analysis:
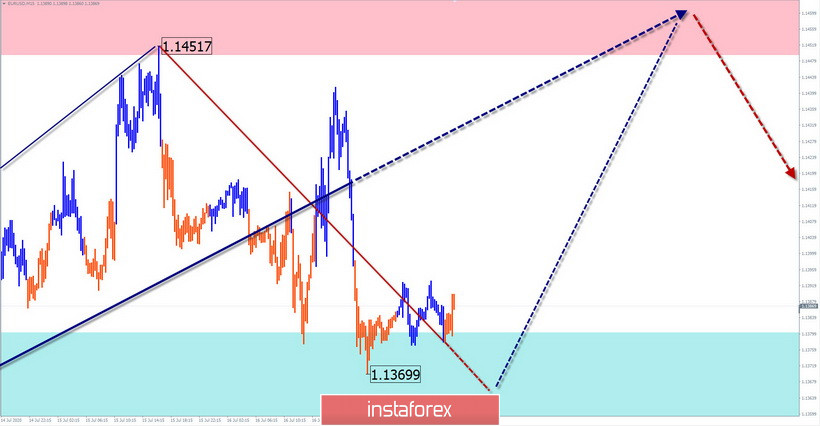
A correction has been forming in the structure of the dominant ascending wave since June 5. It has the form of a shifting plane. The wave (B) continues to extend upwards. It lacks the final part.
Forecast:
The pair's price movement today is limited to the nearest counter zones. After an attempt to pressure the support zone, the exchange rate is expected to change and a second attempt to break up is expected.
Potential reversal zones
Resistance:
- 1.1450/1.1480
Support:
- 1.1380/1.1350
Recommendations:
Today, trading the euro on the market is possible only within the framework of the intra-session style. The emphasis is offered to make purchases of the tool. In the area of the calculated resistance zone, after the appearance of reversal signals, you should change the trading vector.

USD/JPY
Analysis:
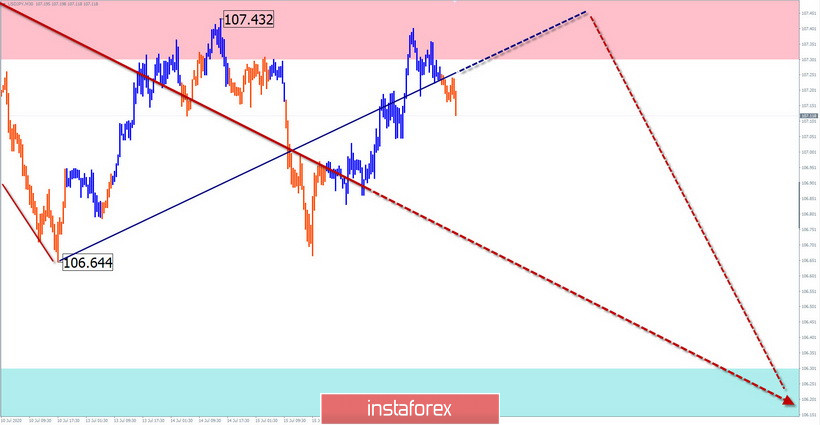
The direction of the short-term trend of the Japanese yen since June 5 is set by the bearish wave algorithm. Since the beginning of July, the final part has been developing. It is nearing completion of an interim pullback. The resistance zone shows the most likely part of its completion.
Forecast:
Today, it is expected to complete the last decade of the pair's corrective movement, form a reversal and start the price move down.
The active phase of decline is more likely at the end of the day.
Potential reversal zones
Resistance:
- 107.30/107.60
Support:
- 106.30/106.00
Recommendations:
Buying yen today is not very promising and is not recommended. The main attention is paid to the search for signals for the sale of the instrument.

Explanation: In the simplified wave analysis (UVA), waves consist of 3 parts (A-B-C). The last incomplete wave is analyzed. The solid background of arrows shows the formed structure, and the dotted ones show the expected movements.
Note: The wave algorithm does not take into account the duration of the tool movements in time!
 English
 Русский
 Bahasa Indonesia
 Bahasa Malay
 ไทย
ไทย Español
 Deutsch
 Български
 Français
 Tiếng Việt
 中文
中文 বাংলা
বাংলা हिन्दी
 Čeština
 Українська
 Română

