To open long positions on GBPUSD, you need:
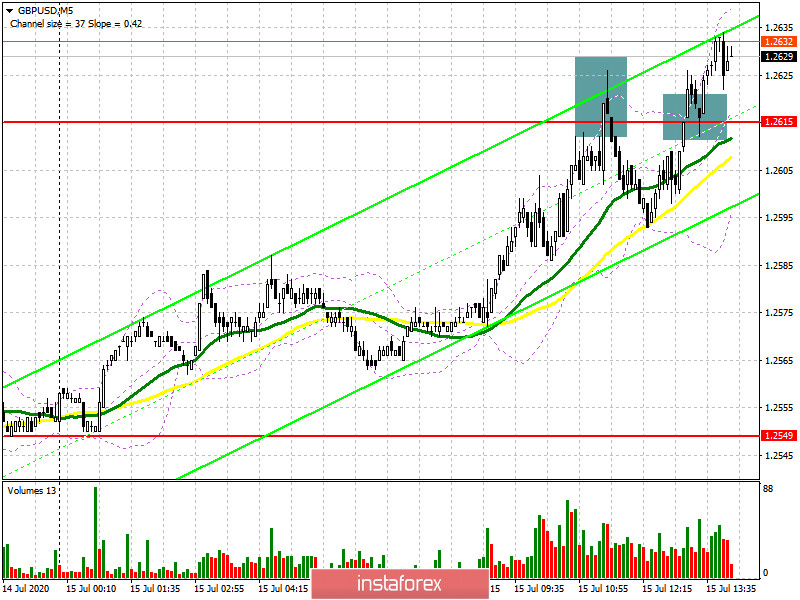
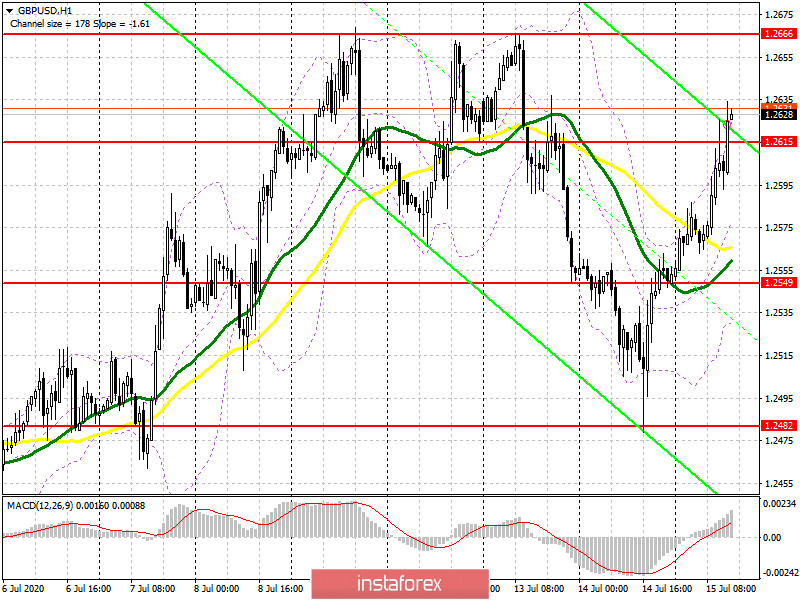
The hope of buyers of the pound was on the data on inflation in the UK, which was slightly better than the forecasts of economists, which allowed to maintain the bullish momentum today in the morning. If you look at the 5-minute chart, you will see how the bears managed to achieve the formation of a false breakout from the level of 1.2615, which led to the formation of a good point for entering short positions. However, it was not possible to achieve a larger movement than 30 points. As a result of a repeated test of the resistance of 1.2615, this level was broken. Now buyers are trying to gain a foothold on it, which forms a signal to open long positions in the hope of continuing the growth of GBP/USD to the maximum area of 1.2666, where I recommend fixing the profits. The longer-term goal is 1.2742 and 1.2809. If the pressure on the pound returns, and the bears achieve a return of the pound to the level of 1.2615, then in this scenario, it is best to exit from long positions and do not rush to buy. The best option is to wait for the update of the minimum of 1.2549, where the moving averages are held, and buy GBP/USD from there immediately for a rebound in the expectation of a correction of 30-40 points within the day.

To open short positions on GBPUSD, you need:
Sellers continue to experience problems, as a sluggish attempt to protect the level of 1.2615 only fueled interest from buyers of the pound, who took this range for themselves the second time. The bears' task for the second half of the day will be to regain this area, which will definitely increase the pressure on the pair and quickly push it to the minimum of the day in the area of 1.2549, where I recommend fixing the profits. The sellers' longer-term goal will be a minimum of 1.2482. If the bulls continue to push the market up, this will lead to a reversal of the downward trend, which will be only a small correction of the bull market from June 30. Short positions on growth are best viewed after the formation of a false breakout near the weekly maximum of 1.2666 or sell GBP/USD immediately on the rebound from the resistance of 1.2742.

Signals of indicators:
Moving averages
Trading is conducted above the 30 and 50 daily averages, which indicates a serious attempt by buyers of the pound to return to the market.
Note: The period and prices of moving averages are considered by the author on the hourly chart H1 and differ from the general definition of the classic daily moving averages on the daily chart D1.
Bollinger Bands
If the pair declines, the lower border of the indicator at 1.2540 will provide support.
Description of indicators
- Moving average (moving average determines the current trend by smoothing out volatility and noise). Period 50. The graph is marked in yellow.
- Moving average (moving average determines the current trend by smoothing out volatility and noise). Period 30. The graph is marked in green.
- MACD indicator (Moving Average Convergence / Divergence - moving average convergence / divergence) Fast EMA period 12. Slow EMA period 26. SMA period 9
- Bollinger Bands (Bollinger Bands). Period 20
 English
 Русский
 Bahasa Indonesia
 Bahasa Malay
 ไทย
ไทย Español
 Deutsch
 Български
 Français
 Tiếng Việt
 中文
中文 বাংলা
বাংলা हिन्दी
 Čeština
 Українська
 Română

