Good day, dear traders!
Yesterday's UK GDP data showed that the UK economy has begun a gradual recovery from the effects of COVID-19. However, this recovery is still quite fragile. The main reason for the revival of economic activity was the removal or easing of a number of restrictions that the government had to impose to stop the spread of coronavirus infection.
However, looking at the economic calendar, we see that British GDP grew by 1.8% in May, which is significantly lower than the forecast value of 5.5%. However, after the previous indicator of minus 20.3%, the May growth of 1.8% may be encouraging. And in general, the economic downturn in the UK caused by COVID-19 was unprecedented.
Today, the Office for National Statistics of the UK will provide data on the consumer price index (they will appear after the completion of this article), and the US will publish reports on industrial production, import prices and the Fed's Beige Book.
Daily

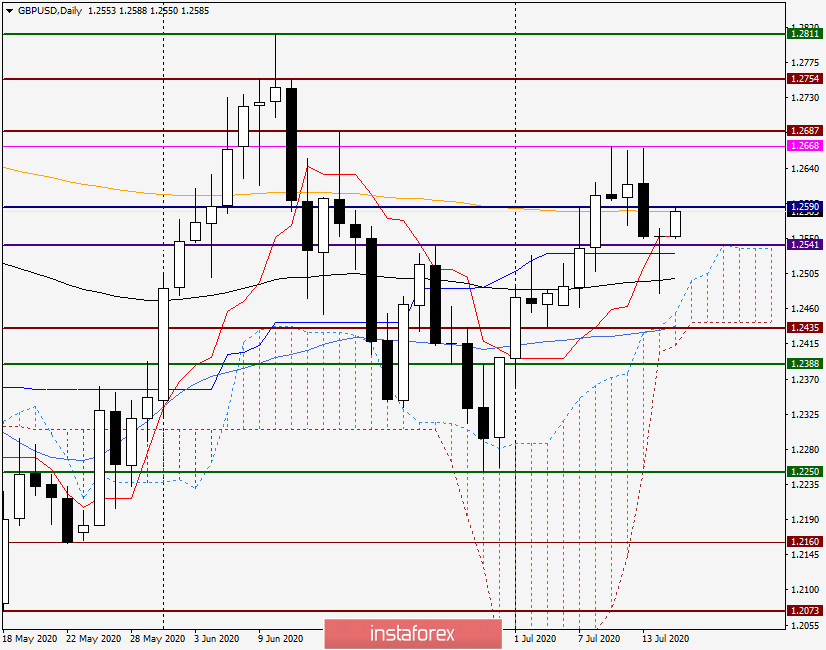
As you can see, the UK GDP data for May, which was below the forecast values, put significant pressure on the British currency. However, after showing the minimum values at 1.2479, the GBP/USD pair began to recover actively and eventually ended Tuesday's trading at 1.2552 where it started. Moreover, point to point!
Of course, here you should pay attention to the long lower shadow of yesterday's candle, which may signal the market's reluctance to move in the southern direction. It should also be noted that the price was supported by the Kijun line of the Ichimoku indicator and its exponential moving average. As a result, yesterday's session ended even higher than the Tenkan line.
In my opinion, these factors indicate the potential growth of sterling against the US dollar. How it will actually be, of course, will show the course of the trading. In case of growth, the nearest targets at the top will be the 200 exponential, which is already being tested for a breakdown, and above it is the same ill-fated area for bulls in the pound of 1.2640-1.2680.
If the market prefers a downward scenario, the nearest target will be yesterday's lows at 1.2479, the update of which will send the pair to 1.2460, 1.2442 and 1.2420.
H4

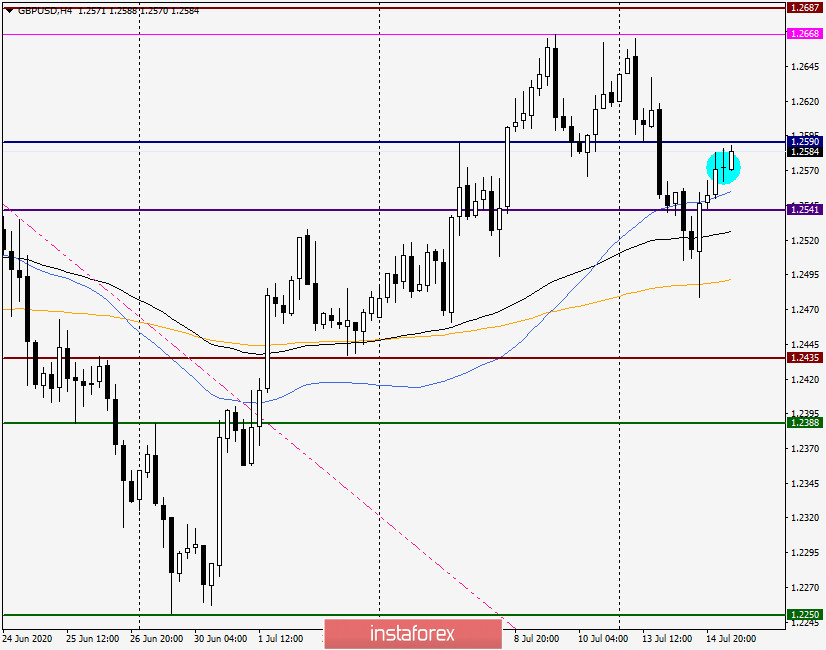
On this timeframe, you can clearly see the support provided by the used moving averages, specifically the orange 200 exponential moving average. This is where the pair turned up and is trading in close proximity to the important technical level of 1.2600.
However, after the appearance of a dedicated doji candle, the bulls on the pound had problems. Now, to continue growing, they need to absorb the selected candle.
If you go to the trading recommendations for GBP/USD, they are reduced to buying the pair. Yesterday's daily candle should not go unnoticed by market participants, and after such patterns, the quote usually increases. As I have repeatedly noted, and this is not a secret or any discovery, it is better to buy cheaper, and sell more expensive. That is why I recommend looking at purchases of the pound after short-term pullbacks to the price zone of 1.2555-1.2515. The confirmation signal, as usual, will be considered a bullish candle (or candles), which will appear on the four-hour or hourly timeframes. For those who trade more aggressive and risky, I can offer purchases at the current price of 1.2575.
In case of reversal bearish candle signals in the price zone of 1.2600-1.2650, you can try selling, but it is better for now with small goals, in the area of 1.2560-1.2545.
Good luck with trading!
 English
 Русский
 Bahasa Indonesia
 Bahasa Malay
 ไทย
ไทย Español
 Deutsch
 Български
 Français
 Tiếng Việt
 中文
中文 বাংলা
বাংলা हिन्दी
 Čeština
 Українська
 Română

