To open long positions on EUR/USD, you need:
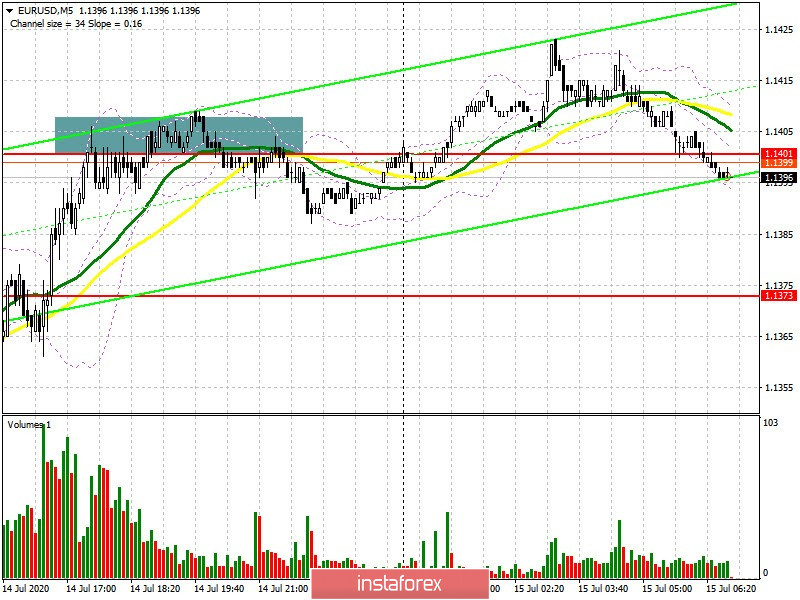
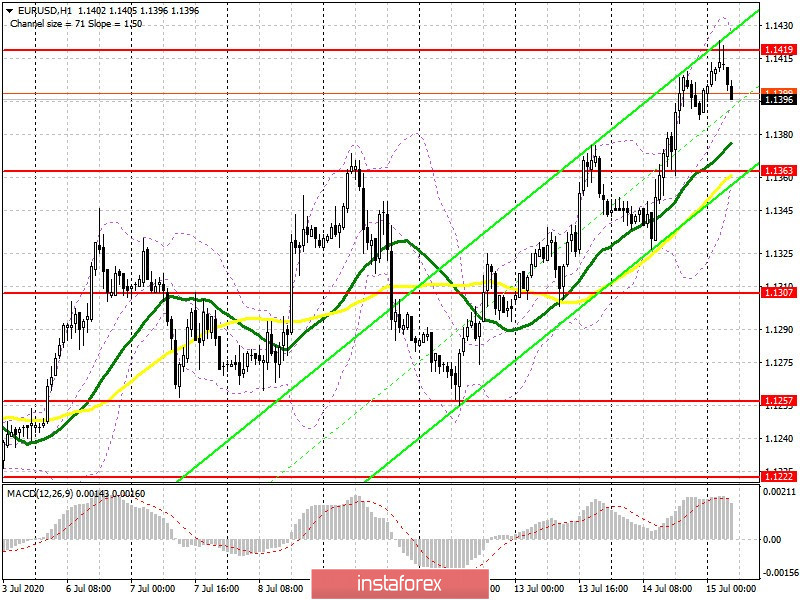
Buyers of the euro managed to break above the level of 1.1373 yesterday and continued to push the pair after good US inflation data. The resistance area of 1.1399 was a small stop, where the bears tried to turn the market in their direction, which can be seen on the 5-minute chart. The technical picture has changed at the moment. The buyers will initially aim for the resistance of 1.1419, consolidating on it will be a new signal to open long positions, which can lead to a high of 1.1462, where I recommend taking profits. The 1.1514 area is still the long-term goal. But do not forget that the European Central Bank will hold a meeting tomorrow, so the desire of investors to increase long positions at current highs will be limited. A more optimal scenario for buying euros will be a downward correction to the support area of 1.1363, from where you can open long positions immediately for a rebound based on 20-25 points of correction. If bulls are not active in this range, it is best to wait for an update of a low of 1.1307 and buy EUR/USD there. It is also worth remembering that the Commitment of Traders (COT) report for July 7 recorded an increase in long positions and a very small rise in short ones, which indicates a gradual increase in demand for risky assets. There are more and more people who want to buy euros in current conditions and at high prices. The report shows an increase in short non-commercial positions from the level of 81,432 to the level of 81,562, while long non-commercial positions jumped from the level of 180,387 to the level of 185,159. As a result, the positive non-commercial net position increased to 103,597, against 98,955, which indicates an increase in interest in purchasing risky assets at current prices.

To open short positions on EUR/USD, you need:
Sellers still have problems. The main task today for the first half of the day is to form a false breakout in the resistance area of 1.1419, which will force speculative buyers of the euro to consolidate some positions. In turn, this will lead to a downward correction to the support area of 1.1363, where the main struggle for direction will unfold. There are also moving averages in this range, which will make life difficult for sellers. Consolidating below the support of 1.1363 will increase pressure on the euro, which will be an additional sell signal with the main goal of returning to the level of 1.1307, where I recommend taking profits. If bears are not active at the level of 1.1419, it is best not to rush to sell against the trend, but wait for an update of new highs in the area of 1.1462 and 1.1514, counting on a correction of 30-40 points within the day.

Indicator signals:
Moving averages
Trading is conducted above 30 and 50 moving averages, which indicates the bullish nature of the market.
Note: the period and prices of moving averages are considered by the author on the hourly chart H1 and differ from the general definition of the classic daily moving averages on the daily chart D1.
Bollinger Bands
Breaking the upper limit of the indicator in the area of 1.1425 will lead to an increase in the euro. A break in the lower border at 1.1363 will increase the pressure on the pair.
Description of indicators
- Moving average (moving average, determines the current trend by smoothing out volatility and noise). Period 50. It is marked in yellow on the chart.
- Moving average (moving average, determines the current trend by smoothing out volatility and noise). Period 30. It is marked in green on the chart.
- MACD indicator (Moving Average Convergence/Divergence — convergence/divergence of moving averages) Fast EMA period 12. Slow EMA period to 26. SMA period 9
- Bollinger Bands (Bollinger Bands). Period 20
- Non-commercial traders are speculators, such as individual traders, hedge funds, and large institutions that use the futures market for speculative purposes and meet certain requirements.
- Long non-commercial positions represent the total long open position of non-commercial traders.
- Short non-commercial positions represent the total short open position of non-commercial traders.
- The total non-commercial net position is the difference between short and long positions of non-commercial traders.
 English
 Русский
 Bahasa Indonesia
 Bahasa Malay
 ไทย
ไทย Español
 Deutsch
 Български
 Français
 Tiếng Việt
 中文
中文 বাংলা
বাংলা हिन्दी
 Čeština
 Українська
 Română

