To open long positions on GBPUSD, you need:
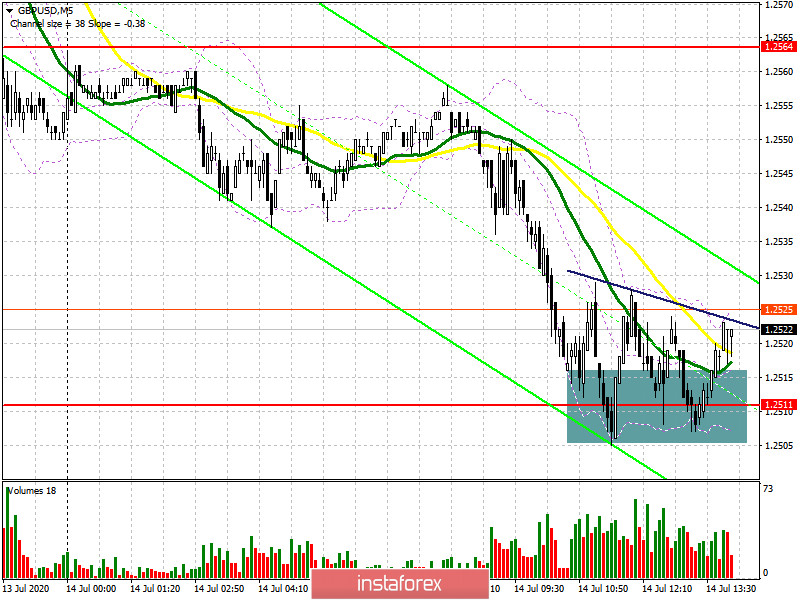
In the first half of the day, I drew attention to an important report on UK GDP growth, which did not reach the pace of recovery expected by economists. This led to a rapid decline in GBP/USD to the support area of 1.2511, without forming a good signal to enter the market from the resistance of 1.2564, which I discussed in more detail in my morning forecast. If you look at the 5-minute chart, you will see how buyers are doing everything possible to keep the pair above the area of 1.2511, but each attempt to grow and exit the channel (see the blue line on the chart) is accompanied by a repeated decline and a test of support for 1.2511. However, as long as trading is above this range, the signal to buy the pound from this level will be valid, which may lead to a larger increase in the GBP/USD in the second half of the day to the resistance area of 1.2564. A break in this range will open the way to the maximum of 1.2615, where I recommend fixing the profits. In the scenario of a breakout of the minimum of 1.2511, and this may happen after the release of inflation data in the US, it is best to postpone new long positions until the support test of 1.2448. You can also buy the pound immediately on a rebound from the low of 1.2386 in the expectation of a correction of 30-40 points within the day.

To open short positions on GBPUSD, you need:
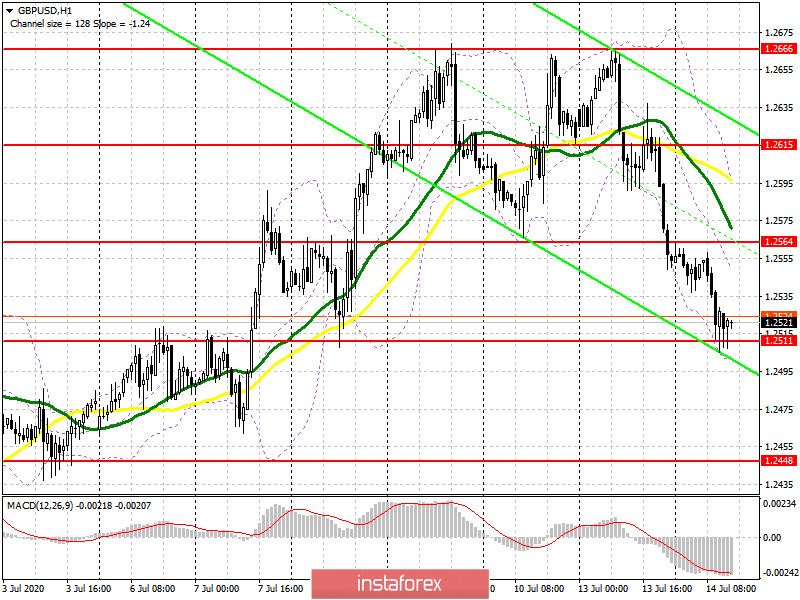
Sellers of the pound have already made the first step and reached the support of 1.2511. Their new goal is to consolidate under this level, which may happen after the release of a bad report on US GDP. This will serve as a new sell signal and increase the pressure on GBP/USD, which will push the pair to the minimum of 1.2448, where I recommend fixing the profits. If there is no activity on the part of sellers at 1.2511, and while the bulls are coping with their task, it is best to postpone short positions in GBP/USD until the formation of a false breakout at 1.2564, which I discussed in more detail in my morning forecast. I recommend opening short positions immediately for a rebound from the weekly maximum of 1.2666, based on a correction of 30-40 points within the day.

Signals of indicators:
Moving averages
Trading is below the 30 and 50 daily averages, which indicates the bearish nature of the market.
Note: The period and prices of moving averages are considered by the author on the hourly chart H1 and differ from the general definition of the classic daily moving averages on the daily chart D1.
Bollinger Bands
A break in the lower border of the indicator at 1.2510 will increase the pressure on the pound. Growth will be limited to the upper level of the indicator in the area of 1.2605, from where you can sell immediately on the rebound.
Description of indicators
- Moving average (moving average determines the current trend by smoothing out volatility and noise). Period 50. The graph is marked in yellow.
- Moving average (moving average determines the current trend by smoothing out volatility and noise). Period 30. The graph is marked in green.
- MACD indicator (Moving Average Convergence / Divergence - moving average convergence / divergence) Fast EMA period 12. Slow EMA period 26. SMA period 9
- Bollinger Bands (Bollinger Bands). Period 20
 English
 Русский
 Bahasa Indonesia
 Bahasa Malay
 ไทย
ไทย Español
 Deutsch
 Български
 Français
 Tiếng Việt
 中文
中文 বাংলা
বাংলা हिन्दी
 Čeština
 Українська
 Română

