To open long positions on EURUSD, you need:
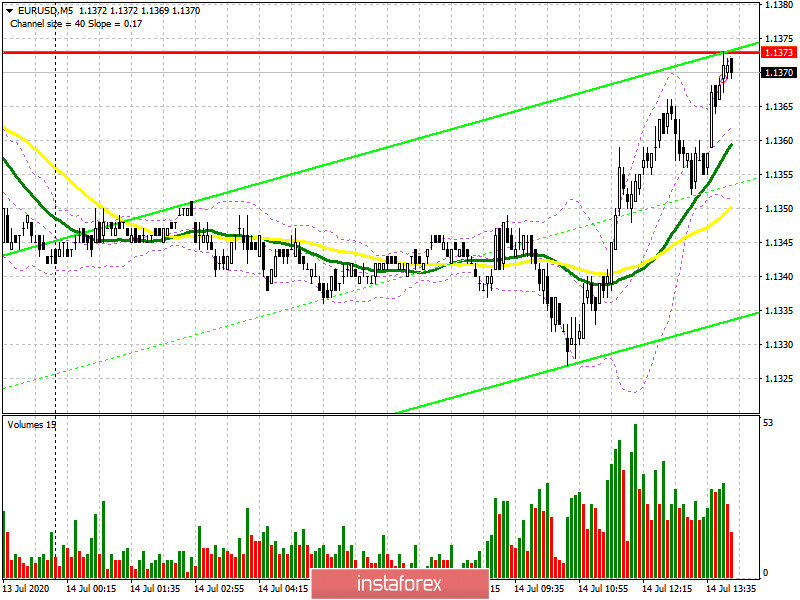
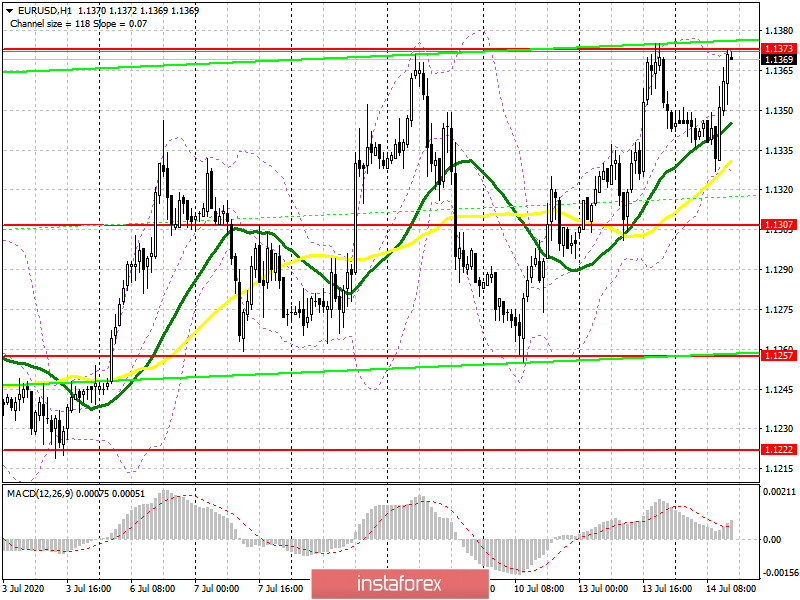
In the first half of the day, I paid attention to a number of fundamental data that could affect the direction of the European currency. But even despite the poor performance, the euro managed to find the strength and get close to the weekly resistance of 1.1373, which indicates the desire of investors to follow a new upward trend. The future direction of the market will depend on how buyers behave at this level after the US inflation report. So far, only the first test of the level of 1.1373 occurred on the 5-minute chart, where growth stopped. To open long positions, you need to break through and consolidate above this resistance, which will open a direct path for euro buyers to the highs of 1.1401, and the longer-term goal will be the area of 1.1430, where I recommend fixing the profits. If the pressure on the euro returns in the second half of the day after the US data, then do not rush to buy. The best option will be long positions immediately on the rebound after the support test of 1.1307, based on a correction of 25-30 points within the day.

To open short positions on EURUSD, you need:
Sellers tried to resume pressure on the euro after the release of quite bad reports on industrial production in the Eurozone, which turned out to be worse than the forecasts of economists. German inflation data coincided with the expectations of economists, which also did not impress traders. In the second half of the day, you need to focus on the formation of a false breakout in the resistance area of 1.1373, the test of which has already occurred today in the first half of the day. The nearest target of the bears remains the support of 1.1307. However, it will be possible to talk about the bears taking control only after fixing below this level, which will be an additional signal to open short positions based on the test of the minimum of 1.1257, where I recommend fixing the profits. If there is no activity from the bears in the resistance area of 1.1373 and good data on the growth of inflation in the US, it is best to wait for the update of new larger highs of 1.1401 and 1.1430 and sell EUR/USD from there in the expectation of a rebound of 25-30 points within the day.

Signals of indicators:
Moving averages
Trading is just above the 30 and 50 daily moving averages, which indicates the sideways nature of the market.
Note: The period and prices of moving averages are considered by the author on the hourly chart H1 and differ from the general definition of the classic daily moving averages on the daily chart D1.
Bollinger Bands
Breaking the lower border of the indicator in the area of 1.1320 will increase pressure on the Euro. Growth above the upper limit at 1.1375 will lead to bullish momentum.
Description of indicators
Description of indicators
- Moving average (moving average determines the current trend by smoothing out volatility and noise). Period 50. The graph is marked in yellow.
- Moving average (moving average determines the current trend by smoothing out volatility and noise). Period 30. The graph is marked in green.
- MACD indicator (Moving Average Convergence / Divergence - moving average convergence / divergence) Fast EMA period 12. Slow EMA period 26. SMA period 9
- Bollinger Bands (Bollinger Bands). Period 20
 English
 Русский
 Bahasa Indonesia
 Bahasa Malay
 ไทย
ไทย Español
 Deutsch
 Български
 Français
 Tiếng Việt
 中文
中文 বাংলা
বাংলা हिन्दी
 Čeština
 Українська
 Română

