The pound was depressed again: British macroeconomic reports published today reminded traders once again of the consequences of the coronavirus crisis. On the one hand, traders did not expect anything interesting from the May figures: in May, Great Britain began to just quit quarantine. Therefore, forecast estimates were very "lenient." On the other hand, traders planned to see at least signs of recovery processes, projecting the May dynamics in the coming months. However, all the reports published today were frankly disappointing. May figures are not far removed from April and were worse in some cases. Immediately after the release, the market started talking again about the probability of a negative rate being introduced by the Bank of England. Traders undeservedly "forgot" this topic, although this issue has not yet been removed from the agenda by the English regulator. And if the June reports are as devastating as the May ones, the Bank of England at the next meeting (August 6) may talk about the negative area again.

But, let's start with today's releases. So, the volume of British GDP in May declined to -19.1%. For comparison: when the country was completely closed for quarantine in April, this figure reached -17.4%. On a monthly basis, the situation is relatively better: the key indicator has left the negative area and rose to 1.8%. But experts expected to see it much higher, at around 5.5%. Industrial production was also disappointing. In monthly terms, the indicator rose by only 6%, while it remained deep in the negative area (-20.1%) on an annualized basis. A similar situation has developed in the field of processing industry (+ 8.4% m / m and -22.8% y/y). In the construction sector, both indicators reached the "red zone" (in May, quarantine restrictions were still in force here). Meanwhile, the indicator almost reached -40% in annual terms. In the services sector, the situation is even worse: the indicator updated the historical anti-record and reached -18.9%. Almost all of the above releases came out in the "red zone", not reaching the predicted values.
It should be noted again that we only learned about the May data today, which a priori could not be positive. But in this case, the slower pace of recovery of key indicators is alarming. And most likely, the published figures are disturbing not only traders, but also members of the English regulator. Let me remind you that the head of the Bank of England, commenting at the last meeting of April's macroeconomic reports, said about the "prevalence of negative." At the same time, the head of the Central Bank once again curtailed to the bears of GBP/USD, talking about the prospects of negative rates. This is a very painful topic for the British currency, which he has previously repeatedly raised, provoking volatility. At the June meeting, Bailey said that Central Bank economists "are trying to figure out the consequences for the UK economy from the experience of other countries with negative rates."
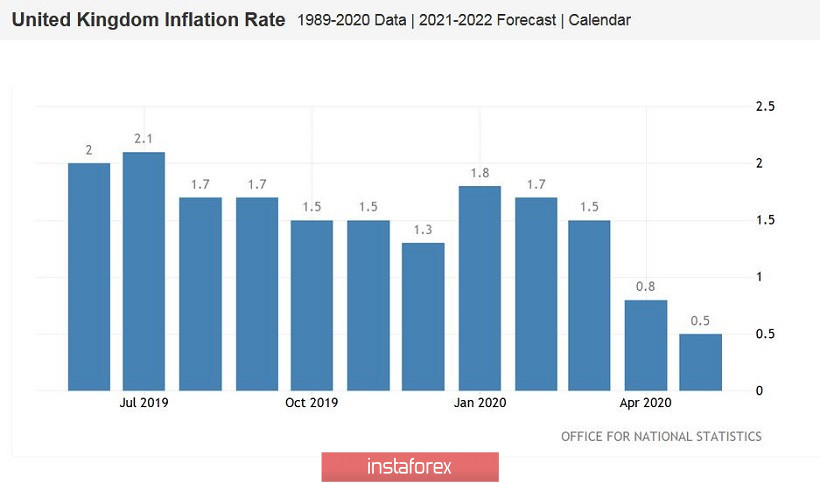
It is likely that at the next (August) meeting, the head of the Central Bank will return to this issue again, given today's releases. This probability will greatly increase if tomorrow's release also comes out in the red zone. On Wednesday, we will find out the growth dynamics of British inflation in June. Preliminary forecasts are expected to be negative: the general consumer price index on a monthly basis should slow down to -0.1%, and - to 0.4% (after the May decline to 0.5%) in annual terms. Core inflation should show similar dynamics, dropping to 1.2%. For bulls of a pair, it is important that inflation data come out at least at the forecast level, otherwise, the bears will get a weighty argument for the additional "sale" of the pair.

It should also be noted that the British side is under pressure from fears that the EU and Britain will not be able to reach a consensus on Brexit. Today, this pressure is of a background nature (in the context of an information vacuum), but the Brexit issue can be compared to a time bomb: at any moment, the situation can "jump" especially given the cautious, but persistent and "often repeated" comments of Boris Johnson that London is ready to implement the "Australian scenario".
However, despite the priority of short positions, it is not worth going into sales at the moment. From a technical point of view, the GBP/USD pair on the daily chart is located between the middle and upper lines of the Bollinger Bands indicator. Sales will be more reliable after sellers sell the price under the middle line of Bollinger Bands, which also coincides with the upper border of the Kumo cloud. It is about 1.2475. If you consolidate below this target, the bears will open the way to the next support level of 1.2290 (the lower line of the Bollinger Bands in the same timeframe).However, only The Brexit issue can lead to such low levels of the pair, so when gaining a foothold below the level of 1.2475, it is advisable to choose the "round" level of 1.2400 as the downward goal.
 English
 Русский
 Bahasa Indonesia
 Bahasa Malay
 ไทย
ไทย Español
 Deutsch
 Български
 Français
 Tiếng Việt
 中文
中文 বাংলা
বাংলা हिन्दी
 Čeština
 Українська
 Română

