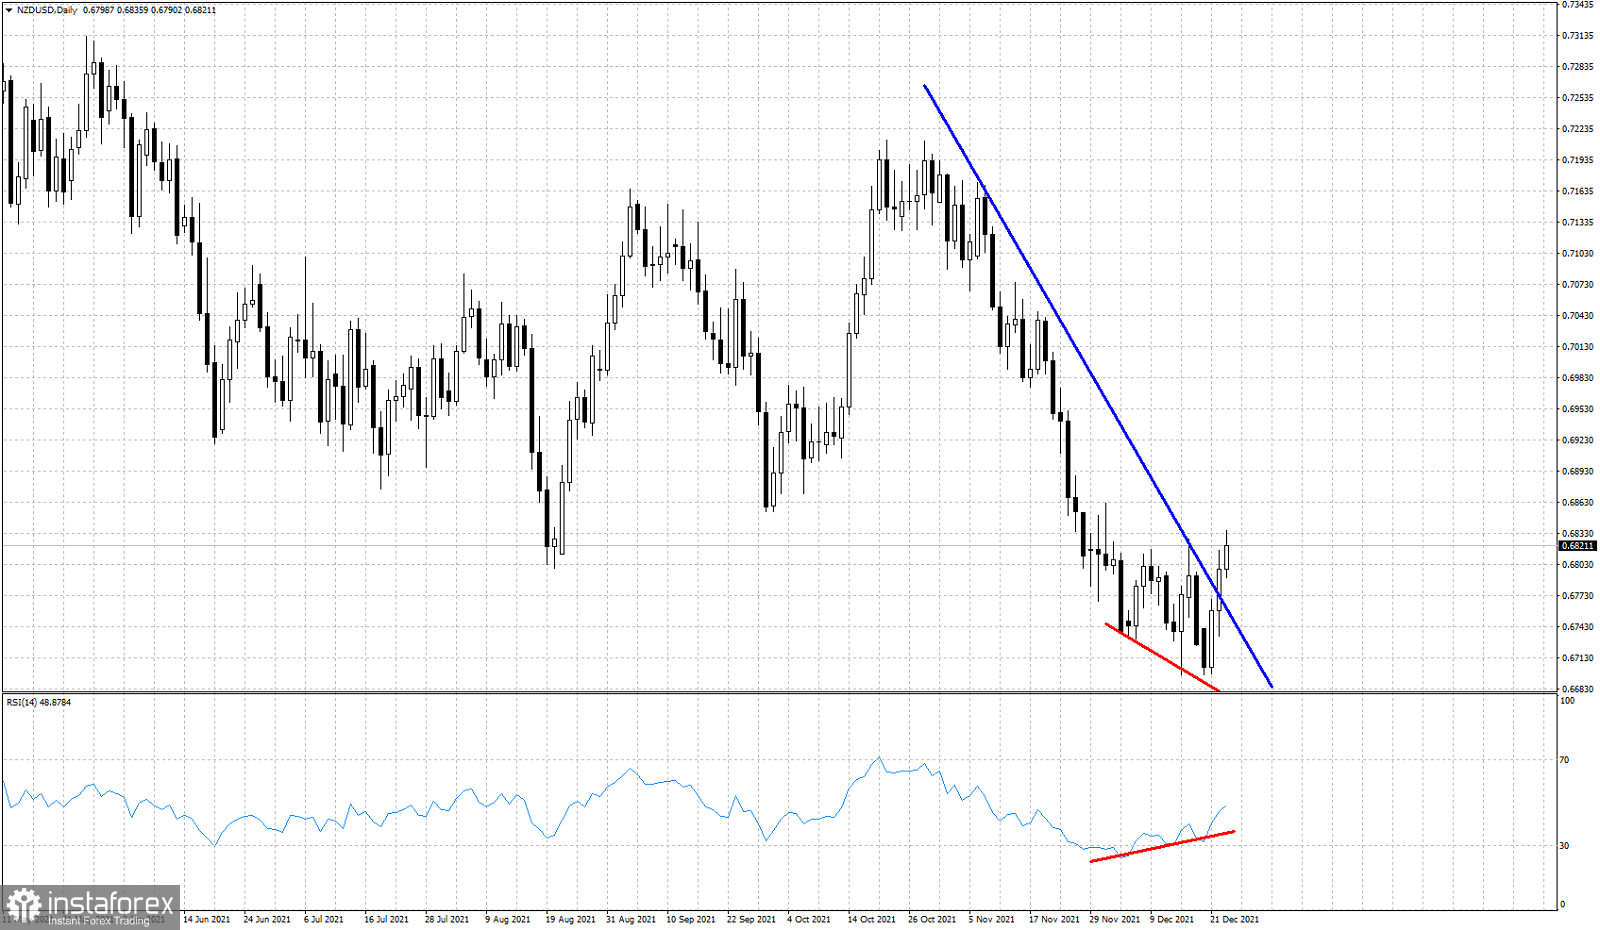
As we mentioned in previous posts, NZDUSD was expected to start an upward reversal from 0.6750. Yesterday price broke above the downward sloping resistance trend line and is now trading around 0.6817.

Blue line - resistance trend line
The combination of the bullish RSI divergence and the break out above the trend line is a bullish sign. We could see a pull back and back test of the broken trend line around 0.6750-0.6770 but it is not necessary. Price has broken above the recent high of 0.6828 and NZDUSD could be at the beginning of a new trend with higher highs and higher lows. It is too early to call a major low, but there are increased chances that the next few sessions at least, will be bullish for NZDUSD.
 English
 Русский
 Bahasa Indonesia
 Bahasa Malay
 ไทย
ไทย Español
 Deutsch
 Български
 Français
 Tiếng Việt
 中文
中文 বাংলা
বাংলা हिन्दी
 Čeština
 Українська
 Română

