To open long positions on EURUSD, you need:
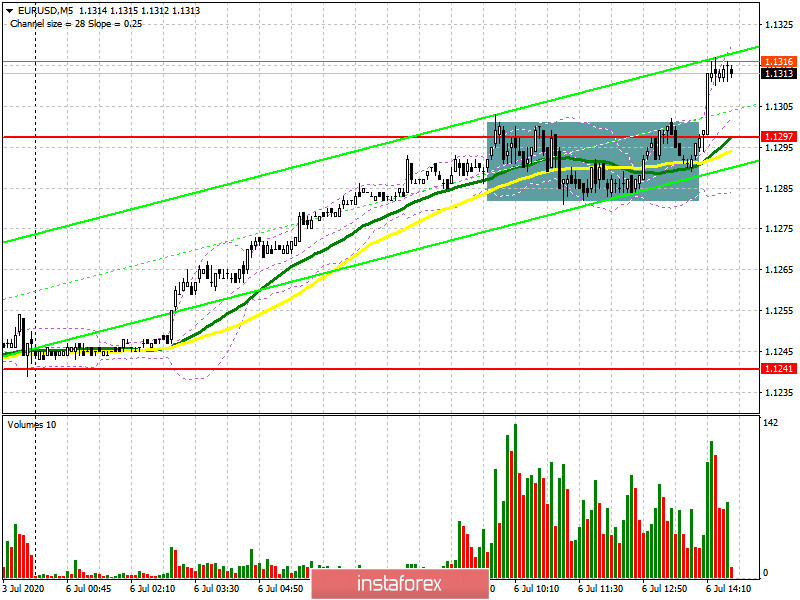
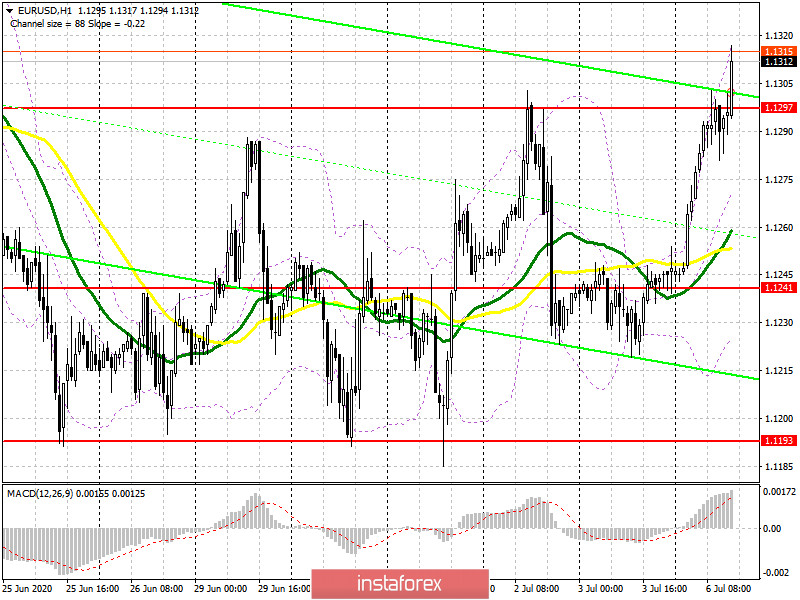
In the first half of the day, I paid special attention to the resistance level of 1.1297, since the entire trading strategy was based on it. If you look at the 5-minute chart, you will see how the bears formed a false breakout in the resistance area of 1.1297 several times. However, each time, the downward trend did not continue, which brought EUR/USD back to the level. The report on the growth of retail trade in the Eurozone was better than the forecasts of economists, which allowed the bulls to keep the pair in the area of 1.1297. The goal of buyers for the second half of the day remains a breakdown and consolidation above this range. However, I recommend opening long positions only after testing this area from top to bottom on the volume, after which the upward trend should immediately continue, which will lead to further growth of the euro in the maximum area of 1.1346. However, its update will also depend on what data will be released today on activity in the US services sector. If the pressure on the euro returns in the second half of the day, and the bulls do not show activity above the level of 1.1241, it is best to wait for another decline to the middle of the channel 1.1241 and open long positions in the expectation of correction of 25-30 points within the day. Larger bulls remain in the area of last week's lows of 1.1193, from where you can buy EUR/USD immediately on the rebound.

To open short positions on EURUSD, you need:
Sellers of the euro are not very lucky yet, as all attempts to resume the downward trend in the first half of the day were unsuccessful. In the afternoon, bears will wait for weak data on activity in the US services sector, which may slightly subdue the demand of euro buyers. However, only the pair's return to the support area of 1.1297, which the bears gave in the first half of the day, and fixing under it will be a signal to open short positions. This scenario will lead to a repeated decline in EUR/USD to the area of the middle of the 1.1241 channel, where the pair spent the entire past week. The longer-term goal of sellers remains the minimum of 1.193, the next test of which will increase pressure on the euro and collapse the pair to the area of 1.155, where I recommend fixing the profits. If the bears fail to return the pair to the support of 1.1297 in the second half of the day, it is best to postpone short positions until the upper limit of the 1.1346 channel is updated, which is now gradually approaching the euro. You can sell from there immediately on the rebound in the expectation of correction by the end of the day of 25-30 points.

Signals of indicators:
Moving averages
Trading is conducted above the 30 and 50 daily moving averages, which indicates a gradual increase in the advantage of euro buyers.
Note: The period and prices of moving averages are considered by the author on the hourly chart H1 and differ from the general definition of the classic daily moving averages on the daily chart D1.
Bollinger Bands
In case of a decline in the euro, the average border of the indicator around 1.1270 will provide support, and you can only buy EUR/USD for a rebound from the minimum of 1.1225.
Description of indicators
- Moving average (moving average determines the current trend by smoothing out volatility and noise). Period 50. The graph is marked in yellow.
- Moving average (moving average determines the current trend by smoothing out volatility and noise). Period 30. The graph is marked in green.
- MACD indicator (Moving Average Convergence / Divergence - moving average convergence / divergence) Fast EMA period 12. Slow EMA period 26. SMA period 9
- Bollinger Bands (Bollinger Bands). Period 20
 English
 Русский
 Bahasa Indonesia
 Bahasa Malay
 ไทย
ไทย Español
 Deutsch
 Български
 Français
 Tiếng Việt
 中文
中文 বাংলা
বাংলা हिन्दी
 Čeština
 Українська
 Română

