 English
  Русский
 Bahasa Indonesia
 Bahasa Malay
 ไทย
ไทย Español
 Deutsch
 Български
 Français
 Tiếng Việt
 中文
中文 বাংলা
বাংলা हिन्दी
 Čeština
 Українська
 Română

Trend analysis (Fig. 1).
On Friday, the pair is likely to continue moving down from the level of 1.2603 (the closing price of yesterday's candlestick) with the target at the retracement level of 1.2532 - 38.2% (the red dotted line). Most likely, the price will continue falling from this level with the target at 1.2445, the pullback level of 50% (the red dashed line).
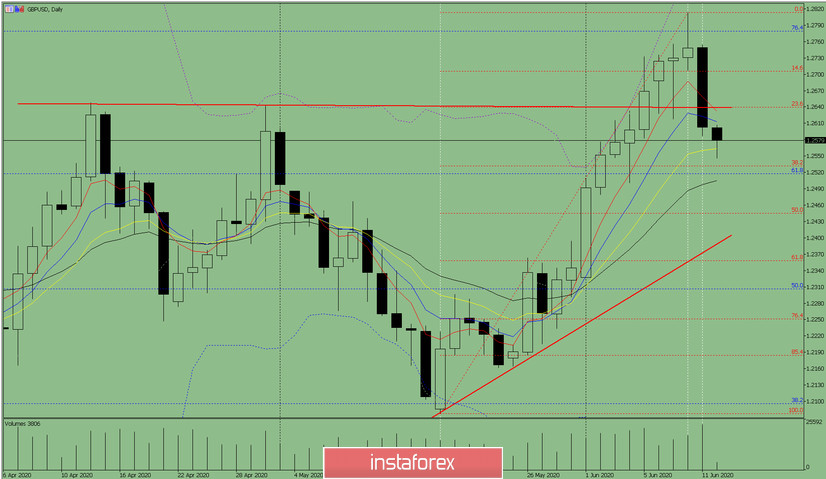
Fig. 1 (daily chart).
Comprehensive analysis:
- indicator analysis - down;
- Fibonacci retracement levels - down;
- volumes - down;
- candlestick analysis - down;
- trend analysis - down;
- Bollinger Lines - down;
- weekly chart - down.
General conclusion:
Today, the pair is likely to continue moving down from the level of 1.2603 (the closing price of yesterday's candlestick) with the target at the retracement level of 1.2532 - 38.2% (the red dotted line). Most likely, the price will continue falling from this level with the target at 1.2445, the pullback level of 50% (the red dashed line).
In the unlikely scenario, if the price drops and reaches the retracement level of 1.2532, 38.2% (the red dashed line), it may start rising with the target at the resistance level of 1.2640 (the red bold line).