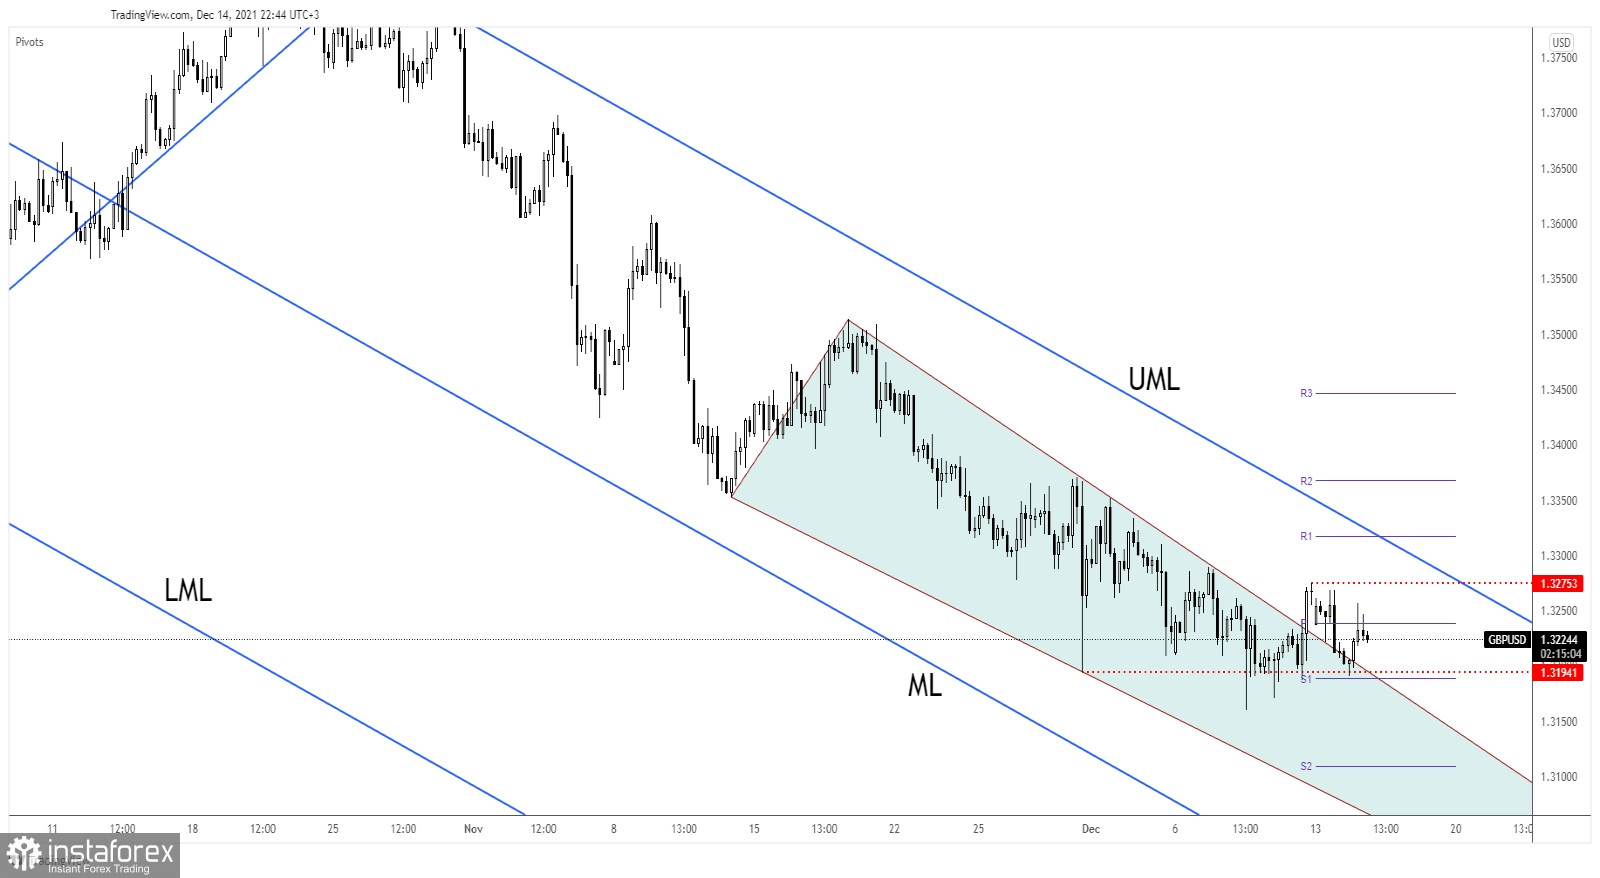
The GBP/USD pair slipped lower from 1.3256 today's high and now it is traded at 1.3225. In the short term, it could move sideways between 1.3275 and 1.3194 levels. Technically, the pair signaled a potential upwards movement after escaping from the Falling Wedge pattern.
In the first part of the day, GBP/USD increased. The pound was boosted by the UK's data. The Unemployment Rate dropped from 4.3% to 4.2% matching expectations, the Claimant Count Change was reported at -49.8K above -31.5K, while the Average Earnings Index registered a 4.9% growth versus 4.6% expected.
Still, the Dollar Index was bullish despite a temporary decline. The US PPI and Core PPI came in better than expected which forced the USD to take the lead again.
GBP/USD massive selling pressure

GBP/USD increased a little after failing to stabilize below 1.3200 psychological level but it has found resistance right above the 1.3238 weekly pivot point. The support stands at the 1.3194 level. As long as it stays above it, GBP/USD could still try to come back higher.
The price retested the Falling Wedge's broken resistance but only a new higher high, a bullish closure above 1.3275 former high could really activate a new leg higher.
GBP/USD prediction
In the short term, GBP/USD could move sideways between 1.3275 and 1.3194 levels. A valid breakout from this range could bring new trading opportunities. Technically, we have a strong demand zone below the 1.32 psychological level, the price registered only false breakdowns below this zone. A sideways movement followed by a valid breakout above 1.3275 could activate an upside reversal.
 English
 Русский
 Bahasa Indonesia
 Bahasa Malay
 ไทย
ไทย Español
 Deutsch
 Български
 Français
 Tiếng Việt
 中文
中文 বাংলা
বাংলা हिन्दी
 Čeština
 Українська
 Română

