 English
  Русский
 Bahasa Indonesia
 Bahasa Malay
 ไทย
ไทย Español
 Deutsch
 Български
 Français
 Tiếng Việt
 中文
中文 বাংলা
বাংলা हिन्दी
 Čeština
 Українська
 Română

Ethereum was plunging at the time of writing after escaping from a major chart pattern. It's traded at 3,739.00 above 3,669.48 today's low. Today, ETH/USD registered an 11.45% drop from 4,144.01 today's high to the daily low.
The price of Bitcoin dropped forcing Ethereum to slip lower as well. The crypto failed to stay in the buyer's territory. Then, it has opened the door for a deeper drop. In the short term, the bias is bearish, so ETH/USD could approach and reach near-term downside obstacles.
ETH/USD downside pressure
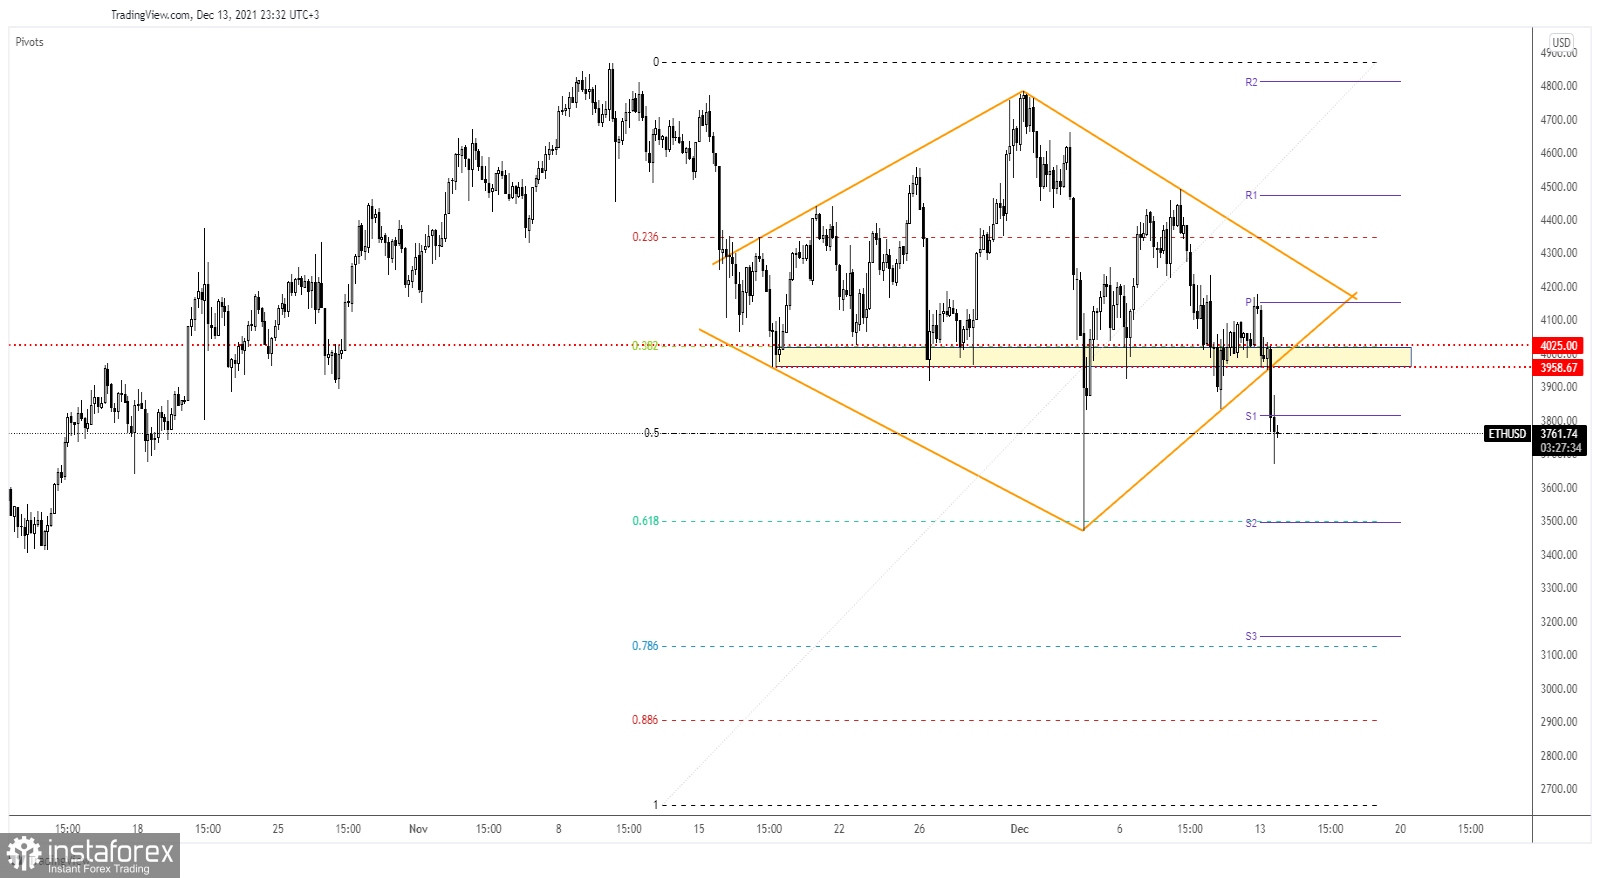
Ethereum failed to stay above the 3,958.67 - 4,025.00 area. It has registered an aggressive breakdown through the confluence area formed at the intersection between the uptrend line and 3,958.67, having activated the Diamond pattern.
The current breakdown from the major pattern signaled a potential further drop. Stabilizing below the S1 (3816.17) and under 50% retracement level may signal more declines towards 61.8% (3,499.60) retracement level, and down to the S2. Also, 3,470.02 lower low stands as a downside target.
ETH/USD forecast
The aggressive breakdown through the confluence area formed at the intersection of the uptrend line with the 3,958.67 signaled downside continuation. After the current sell-off, we cannot exclude a temporary rebound. A bounce-back could bring new bearish opportunities.
Only a major bullish pattern could announce that the corrective phase is over and that ETH/USD could develop a new leg higher. It remains to see how it will react around 61.8%. A valid breakdown below this level could really announce a larger drop.