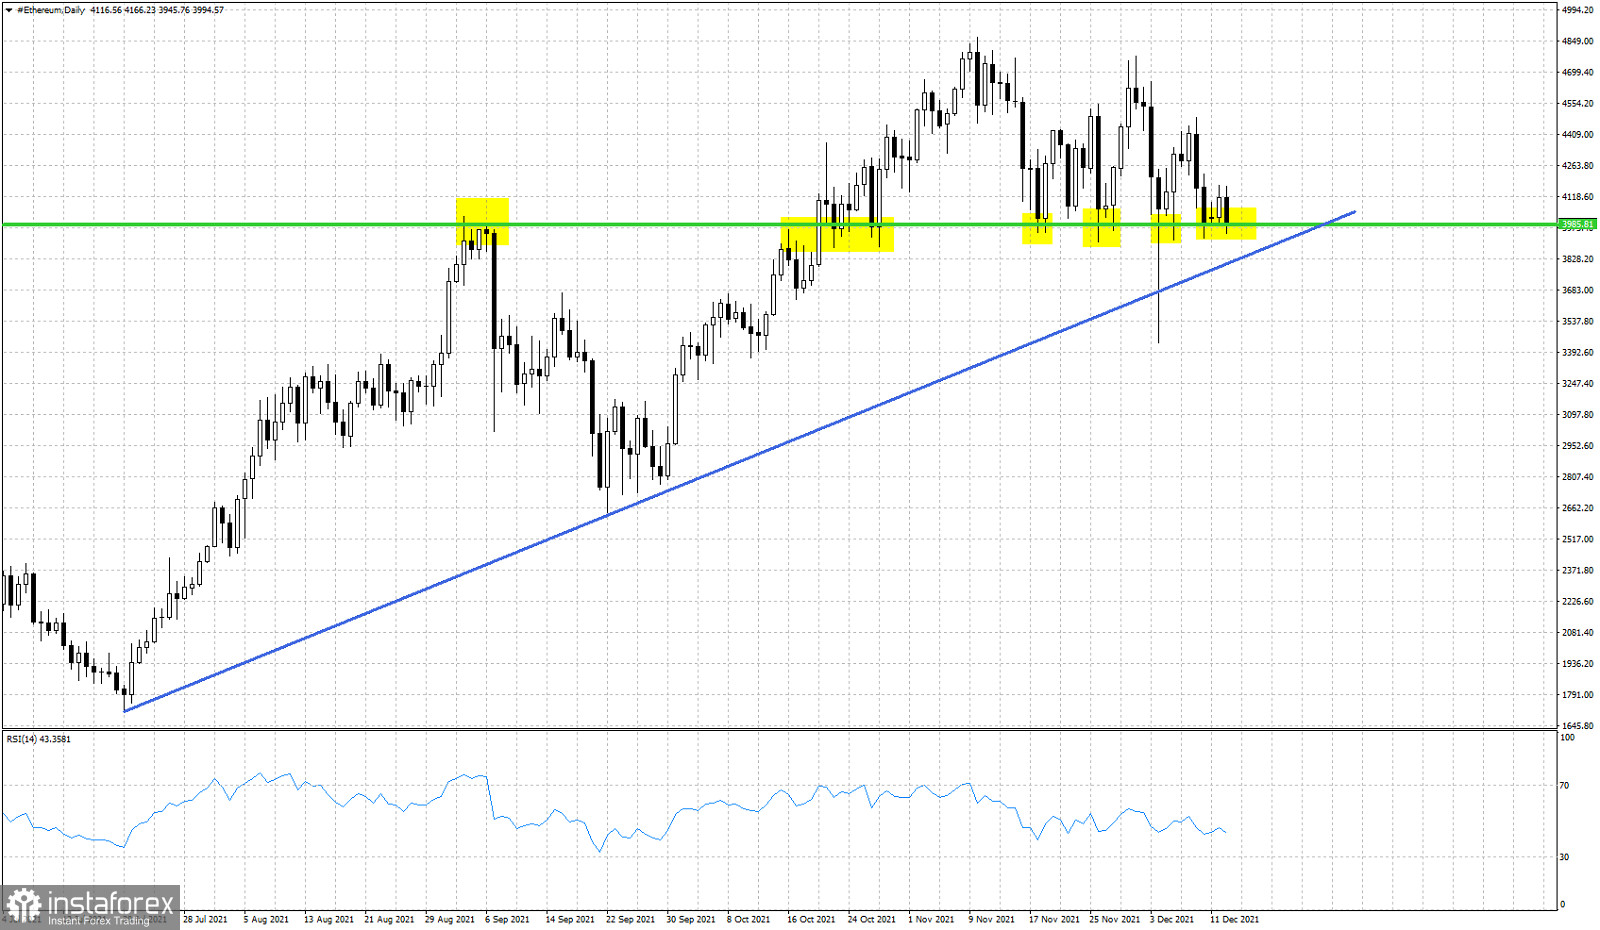
Ethereum has been moving mostly sideways in the last 40 days with no real progress to the upside or the downside. Even after the strong sell off two Saturdays ago, price bounced swiftly bounced back above the key support level of $3,985-$3,930.

Blue line- trend line support
Yellow rectangles- previous tests of horizontal support/resistance
Ethereum has been testing the $3,985-$3,930 zone as resistance or support since August. There is a high frequency of tests and in most cases bulls managed to respect support and not make a Daily close below it. Even after the huge sell off two weeks ago, price did not close below the horizontal support. Price however is also forming lower highs. The descending triangle pattern is another warning signal that if combined with a break below the $3,985-$3,930 zone, we will get a new bearish signal. Next support is found at the blue upward sloping trend line. Breaking below this trend line will increase the chances of a major pull back in Ethereum, maybe towards $3,000.
 English
 Русский
 Bahasa Indonesia
 Bahasa Malay
 ไทย
ไทย Español
 Deutsch
 Български
 Français
 Tiếng Việt
 中文
中文 বাংলা
বাংলা हिन्दी
 Čeština
 Українська
 Română

