To open long positions on EUR/USD, you need:
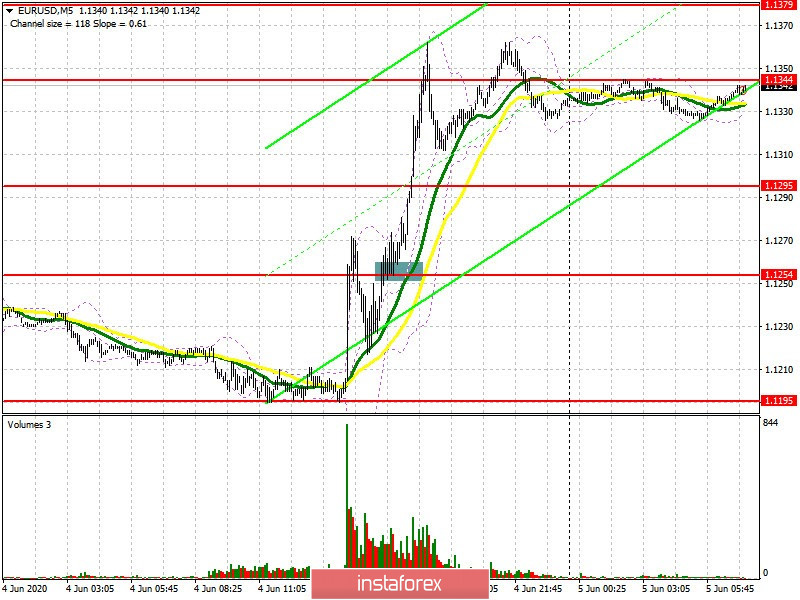
I think a lot of people already know that yesterday, the European regulator increased the emergency program for the purchase of PEPP assets by 600 billion euros, which led to such a strong increase in the euro in the short term. If you look at the 5-minute chart, you will see how returning to resistance 1.1254 and consolidating above this level during European Central Bank Preside Christine Lagarde's speech formed a good signal for buying the euro for those who did not manage to do this from support at 1.1195 in the morning, where I also advise you to open long positions. As a result, a powerful bullish momentum led to renewing the high of 1.1344, which is now transformed into resistance at 1.1358. Euro buyers are significantly aiming for this level, since a break and consolidation in this range will keep EUR/USD attractive and will result in strengthening towards highs 1.1422 and 1.1459, where I recommend taking profits. However, we should not forget that data on the state of the US labor market will be released closer to the afternoon, which will surely become a "cold shower" for speculative buyers. In case the pair falls in the morning, you can count on purchases after a correction to the support area of 1.1274, provided that there is a false breakout there. There are moving averages, which will provide additional support to the pair. I advise you to open long positions immediately for a rebound only after testing the low of 1.1195. New COT reports for the week will published today, in which we can expect an increase in long non-profit positions. Let me remind you that there was a fairly intensive growth in long positions last week, which jumped from 167,756 to 175,034. As a result, the positive non-profit net position also increased and amounted to 75,222 against 72,562, which indicates an increase in interest in buying risky assets.

To open short positions on EUR/USD, you need:
So far, sellers are being quite cautious and, judging by the situation, will only return to the market if they have very good data on the number of people employed in the non-agricultural sector of the United States, as well as the unemployment rate. All of these reports should be better than economists had forecasted in order for the US dollar demand to return. The key task of the bears in the first half of the day will be to form a false breakout in the resistance area of 1.1358, which will lead to a downward correction of EUR/USD to the support area of 1.1274, where I recommend taking profits, since a break below this level without good support for fundamental data will be very problematic. Bears will further aim for 1.1195. If the upward trend in EUR/USD continues, and most likely it will be so, then after breaking through resistance 1.1358, I advise you to consider new short positions only after updating resistance 1.1422 or selling the euro immediately for a rebound from a high of 1.1459 with the aim of a downward correction of 30- 40 points within the day.
Signals of indicators:
Moving averages
Trading is above 30 and 50 moving averages, which indicates the continuation of the bull market.
Note: The period and prices of moving averages are considered by the author on the hourly chart H1 and differs from the general definition of the classic daily moving averages on the daily chart D1.
Bollinger bands
The euro's growth may be limited by the upper level of the indicator at 1.1395. In case the pair falls, support will be provided by the lower border of the indicator in the region of 1.1245.
Description of indicators
- Moving average (moving average determines the current trend by smoothing out volatility and noise). Period 50. The graph is marked in yellow.
- Moving average (moving average determines the current trend by smoothing out volatility and noise). Period 30. The graph is marked in green.
- MACD indicator (Moving Average Convergence / Divergence - Moving Average Convergence / Divergence). Fast EMA period 12. Slow EMA period 26. SMA period 9.
- Bollinger Bands (Bollinger Bands). Period 20.
- Non-profit traders are speculators, such as individual traders, hedge funds and large institutions that use the futures market for speculative purposes and meet certain requirements.
- Long nonprofit positions represent the total long open position of nonprofit traders.
- Short nonprofit positions represent the total short open position of nonprofit traders.
- The total non-profit net position is the difference between the short and long positions of non-profit traders.
 English
 Русский
 Bahasa Indonesia
 Bahasa Malay
 ไทย
ไทย Español
 Deutsch
 Български
 Français
 Tiếng Việt
 中文
中文 বাংলা
বাংলা हिन्दी
 Čeština
 Українська
 Română

