 English
  Русский
 Bahasa Indonesia
 Bahasa Malay
 ไทย
ไทย Español
 Deutsch
 Български
 Français
 Tiếng Việt
 中文
中文 বাংলা
বাংলা हिन्दी
 Čeština
 Українська
 Română

USDCHF made a high at 0.9263 yesterday near the 61.8% Fibonacci retracement. Price made a lower high and got rejected once again at the same Fibonacci resistance area. This is a sign of weakness and more downside to come.
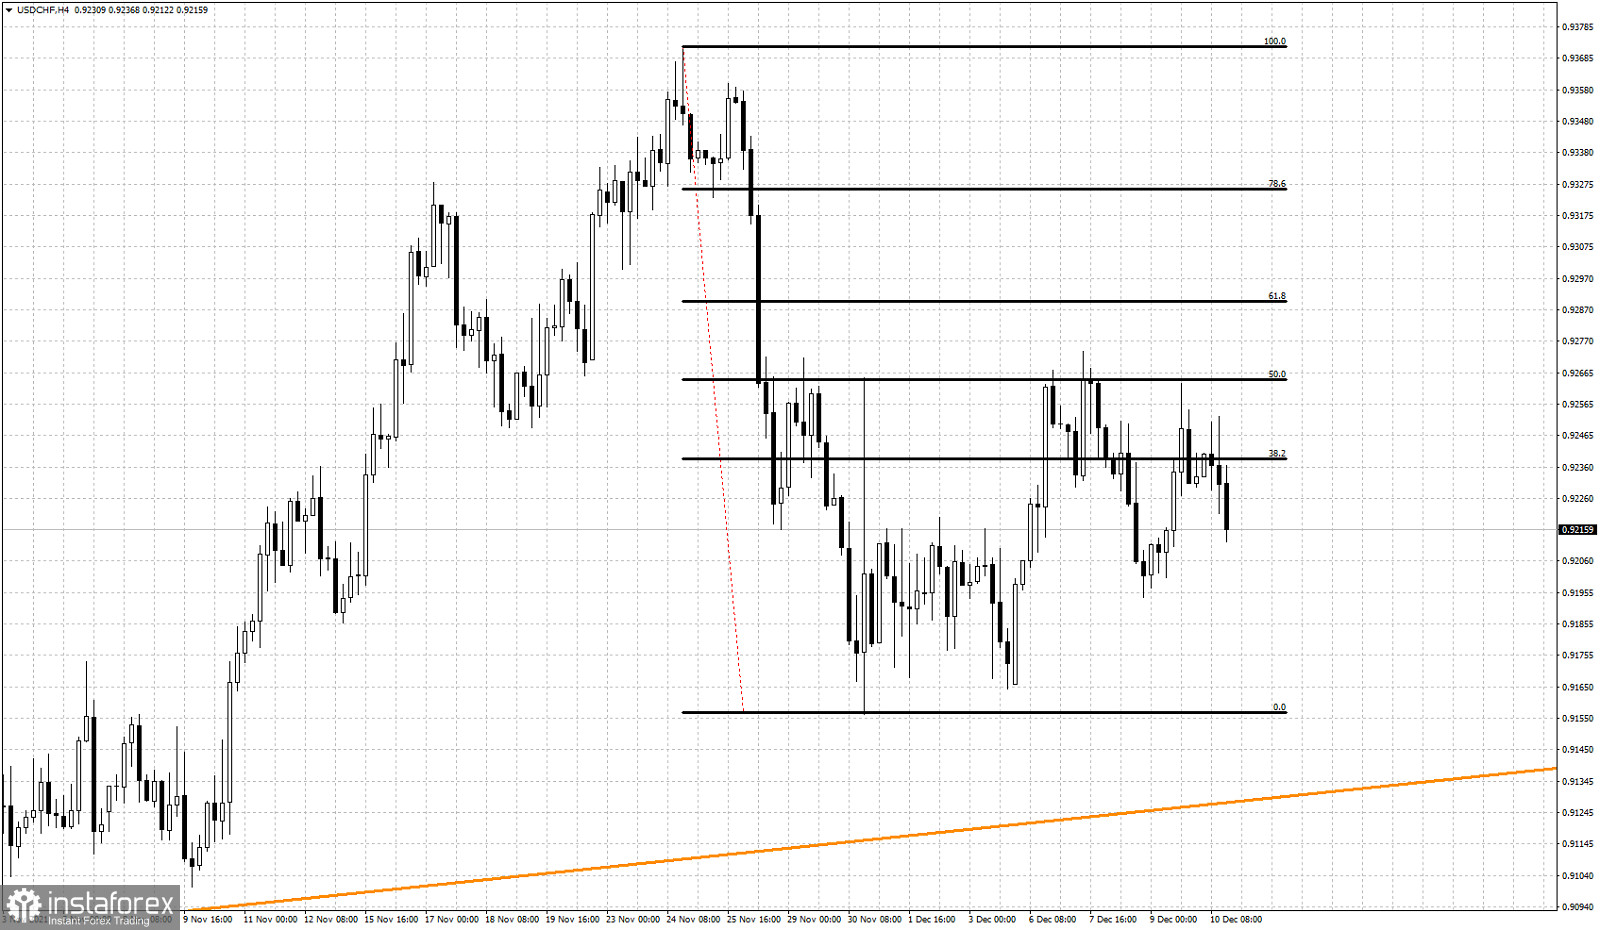
Black lines- Fibonacci retracements
USDCHF has made a higher low and is now moving lower towards 0.9216. Support is at recent low at 0.9194 and failure to stay above it, will be a sign of weakness. Such a breakdown will most probably lead to lower lows and lower highs confirming the short-term trend change to bearish. If price starts a sequence of lower lows and lower highs, we should then expect price to challenge the major support trend line at 0.9129. As long as price gets rejected at the 61.8% Fibonacci retracement, we remain bearish for the coming week.