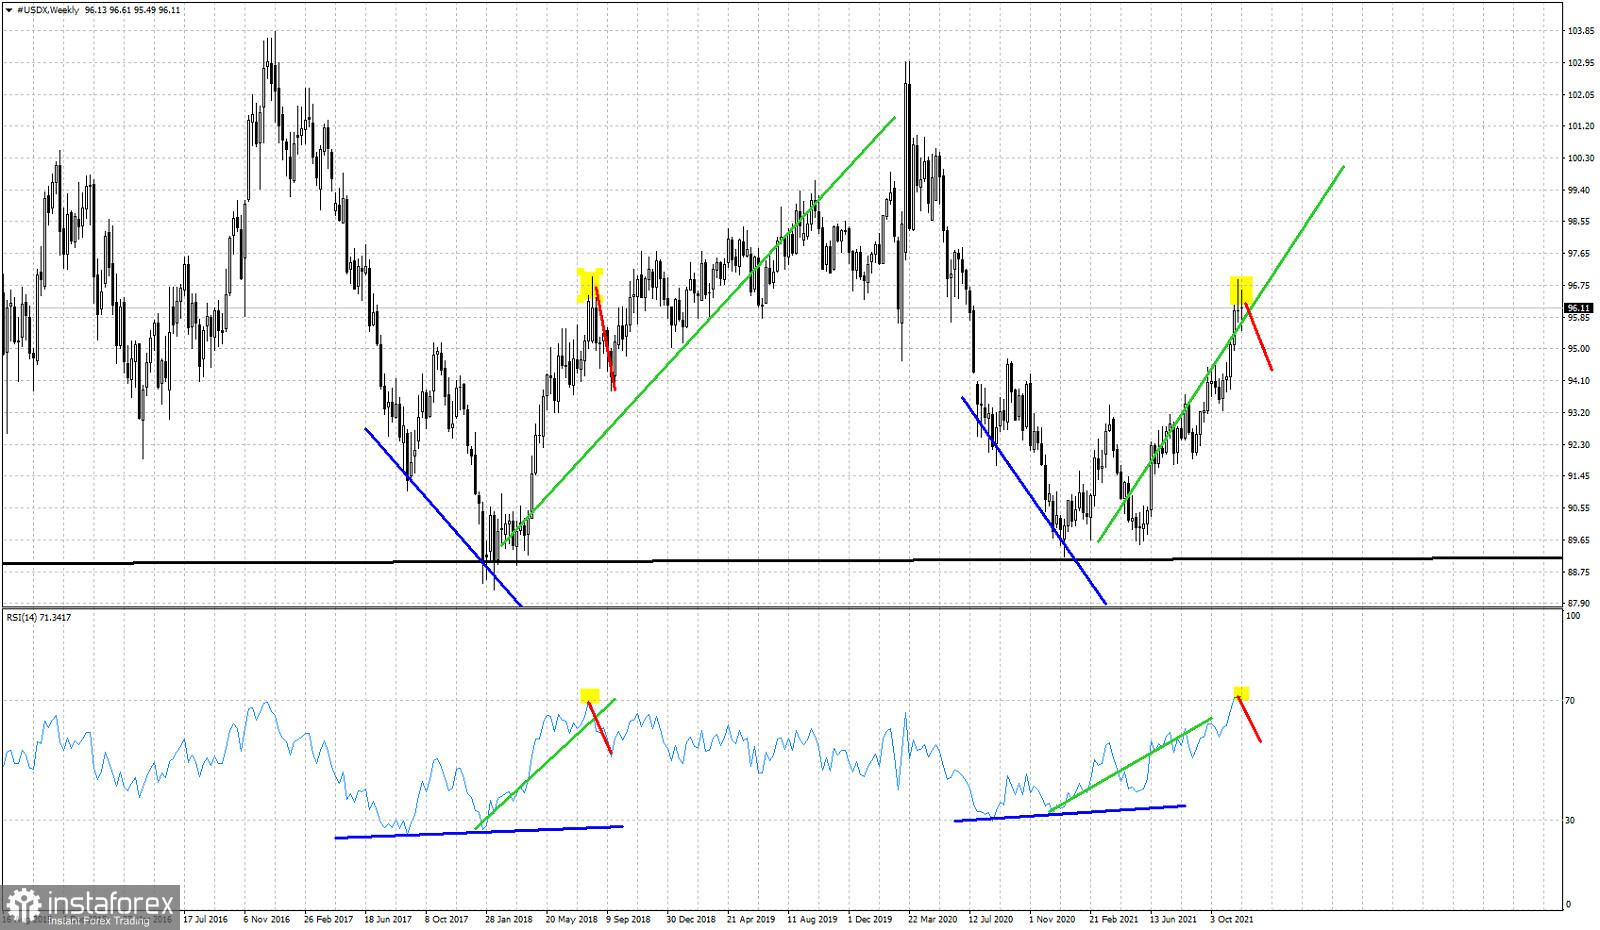
In previous posts during this past year we mentioned many times the similarities of price action now and price action back in 2017 when it made another base around 89-90 and started a new upward movement towards 103. As we expected the reversal to the upside when price was trading around 89-90, we now see similarities to 2017 and expect a pull back that could last 2-5 weeks.

Blue lines- bullish divergence
Green lines -expected path
Yellow rectangles- Price and RSI tops
Red lines- expected path
With the RSI at the overbought level, a 2 to 5 week pull back is justified if price continues to follow the roadmap from 2017. Shorter-term charts also justify such a pull back and that is why I believe there are increased chances of this happening. Maybe tomorrow's NFP announcement will be the spark that starts a move lower against the Dollar. One thing is for sure, volatility is expected to rise very soon and most probably the Dollar will be under pressure. Traders just need to be patient and watch for clues. No need to front run the market.
 English
 Русский
 Bahasa Indonesia
 Bahasa Malay
 ไทย
ไทย Español
 Deutsch
 Български
 Français
 Tiếng Việt
 中文
中文 বাংলা
বাংলা हिन्दी
 Čeština
 Українська
 Română

