Bitcoin (BTC/USD) and most of major altcoins are struggling to find bullish momentum, a possible sign that prices could continue to weaken in the coming days.
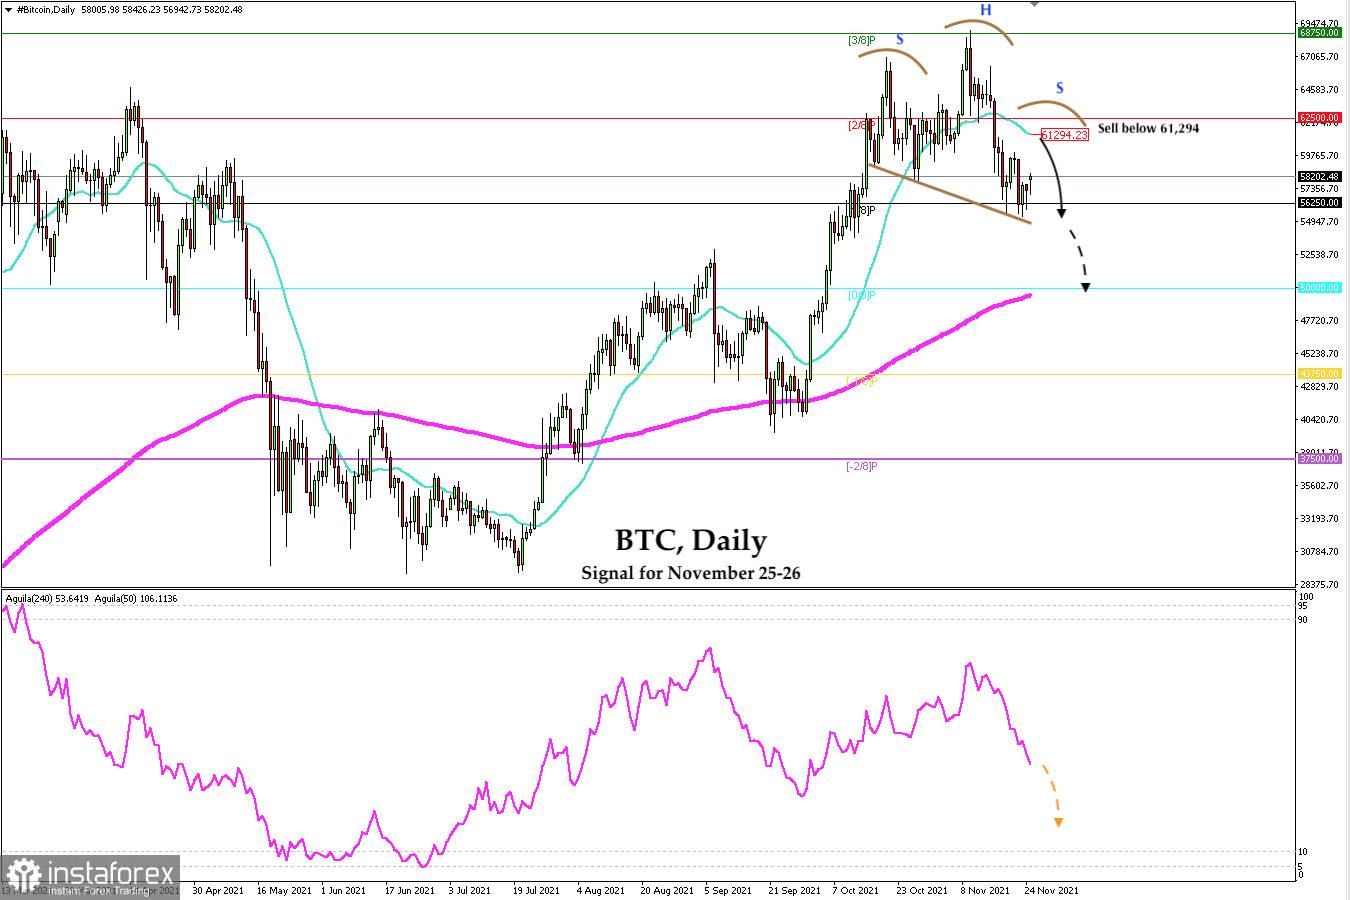
BTC price is trading below the strong resistance of 2/8 murray and below the 21-day moving average, around 61,294. As long as it remains below this zone, BTC is expected to continue oscillating between 56,250 - 62,500.
The bulls are trying to stop the correction near 56,250, but the bears are not willing to give up. On the other hand, BTC has a strong barrier around the 21 SMA located at 61,294 - 62,500, indicating that bears are trying to convert this level as strong resistance.
Since the beginning of October, Bitcoin has been forming a shoulder head shoulder pattern. According to the daily chart, the formation of the second right shoulder is finishing. A sharp break below 56,250 could result in a loss of 10k in price, towards the level of 45,500.
The volume of operations of the cryptocurrency market has decreased as we can see it in the daily chart. The eagle indicator shows a decrease in volume and the strength of the market is likely that a relevant news can send the BTC towards the psychological level of $ 50,000.
Our trading plan is to wait for a technical bounce or a pullback towards the resistance at 62,500 or 61,294. At this level, it will be a good opportunity to sell with targets at 56,200 and up to the 200 EMA located at 50,000.
Support and Resistance Levels for November 25 - 26, 2021
Resistance (3) 62,500
Resistance (2) 59,885
Resistance (1) 58,777
----------------------------
Support (1) 56,900
Support (2) 55,022
Support (3) 54,253
***********************************************************
A trading tip for BTC November 25 - 26, 2021
Sell below 61,294 (21 SMA ) with take profit at 56,250 (1/8) and 50,000 (200 EMA), stop loss above 62,500.
 English
 Русский
 Bahasa Indonesia
 Bahasa Malay
 ไทย
ไทย Español
 Deutsch
 Български
 Français
 Tiếng Việt
 中文
中文 বাংলা
বাংলা हिन्दी
 Čeština
 Українська
 Română

