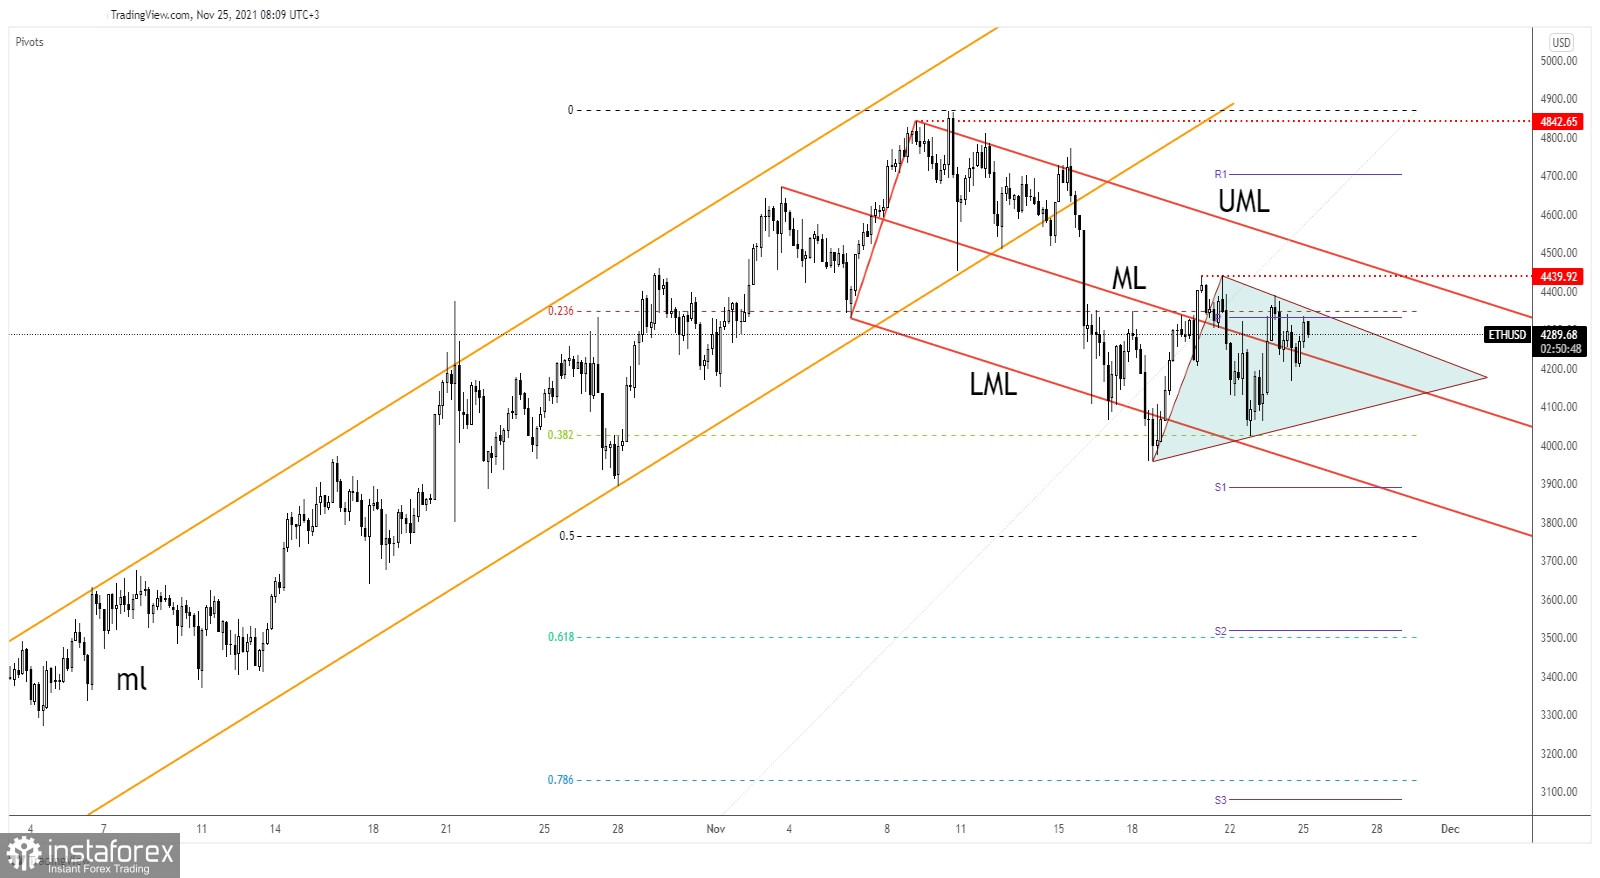
Ethereum is trading at 4,293.88 level and it seems undecided as the price action developed a triangle pattern. It remains to see if the chart formation will be a reversal or a continuation pattern. In the short term, the rate could move sideways trying to attract more bullish energy.
Technically, the crypto signaled that the downside movement is over and that the buyers could take the lead again. Still, we'll have to wait for confirmation before taking action. ETH/USD is up by 0.76%% in the last 7-days and is down by 0.13% in the last 24 hours.
Bitcoin moves sideways as well, so only BTC/USD's rally could force the price of Ethereum to climb higher. Still, Bitcoin could come down to test and retest a support zone before trying to rebound.
ETH/USD Attracts More Buyers!

ETH/USD is traded above the descending pitchfork's median line (ML) but the 23.6% retracement level and the weekly pivot point (4,331.09) stopped the upside movement. It has developed a triangle pattern, an upside breakout from this formation could signal potential further growth.
As you can see, the crypto has found support on the 38.2% retracement level signaling that the downside movement is over.
ETH/USD Outlook!
Ethereum could resume its uptrend only if it jumps and closes above the 4,439.92 and above the descending pitchfork's upper median line (UML). It could try to take out the near-term resistance levels as long as it stays above the median line (ML) or above 38.2% (4,024.81).
 English
 Русский
 Bahasa Indonesia
 Bahasa Malay
 ไทย
ไทย Español
 Deutsch
 Български
 Français
 Tiếng Việt
 中文
中文 বাংলা
বাংলা हिन्दी
 Čeština
 Українська
 Română

