Technical Market Outlook
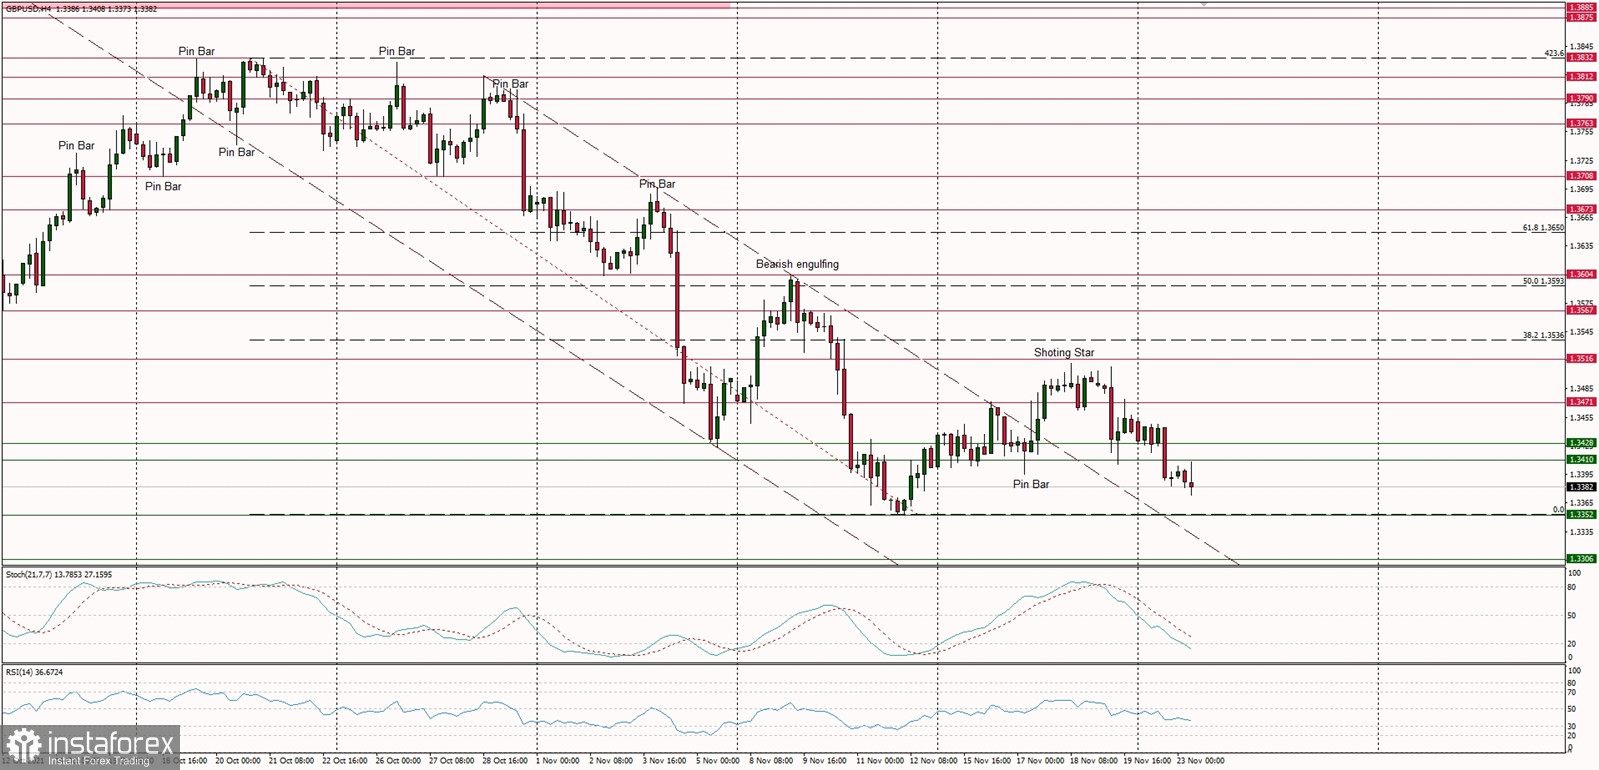
The GBP/USD pair has bounced towards the level of 1.3516, but the bounce was capped and a Shooting Star candlestick pattern was made. The bears had broken out of the narrow range seen between the levels of 1.3428 - 1.3471 and the price is approaching the last swing low located at the level of 1.3352. The key short-term technical resistance is located at the level of 1.3516, just below the 38% Fibonacci retracement of the last wave down located at 1.3536. The intraday technical resistance is seen at 1.3410 and 1.3428.
Weekly Pivot Points:
WR3 - 1.3619
WR2 - 1.3561
WR1 - 1.3497
Weekly Pivot - 1.3445
WS1 - 1.3383
WS2 - 1.3326
WS3 - 1.3259
Trading Outlook:
The down trend on a larger time frame charts is being continued, but only a sustained breakout above the level of 1.3514 would improve the outlook to more bullish with a target at 1.4200. 200 WMA is located at the level of 1.3387 and might provide some temporary support for bulls.

 English
 Русский
 Bahasa Indonesia
 Bahasa Malay
 ไทย
ไทย Español
 Deutsch
 Български
 Français
 Tiếng Việt
 中文
中文 বাংলা
বাংলা हिन्दी
 Čeština
 Українська
 Română

