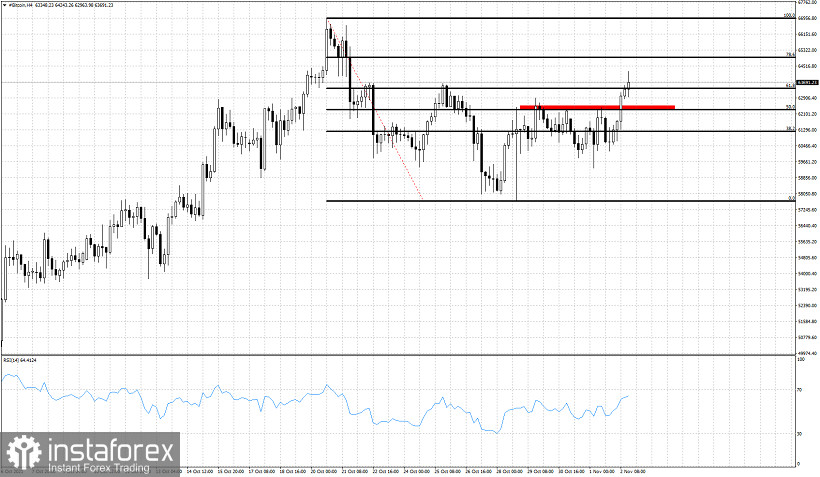
Bitcoin is trading at $63,000 having broken above the horizontal resistance of $62,400. Price has started making higher highs and higher lows in the 4 hour chart. This is an important step in order to build up the next upward move. Bulls need to defend $59,700-$60,000 price level.

Red rectangle -horizontal resistance
Bitcoin is climbing higher. Will this be a lower high? Resistance is at $63,380 and next at $64,900. A rejection at any of these levels will be a sign of weakness. Short-term trend is reversing to bullish as price has started making higher highs. Failure to hold above $59,700-$60,000 will signal another trend reversal back to bearish and will imply that our next target should be below the $57,700 lows.
 English
 Русский
 Bahasa Indonesia
 Bahasa Malay
 ไทย
ไทย Español
 Deutsch
 Български
 Français
 Tiếng Việt
 中文
中文 বাংলা
বাংলা हिन्दी
 Čeština
 Українська
 Română

