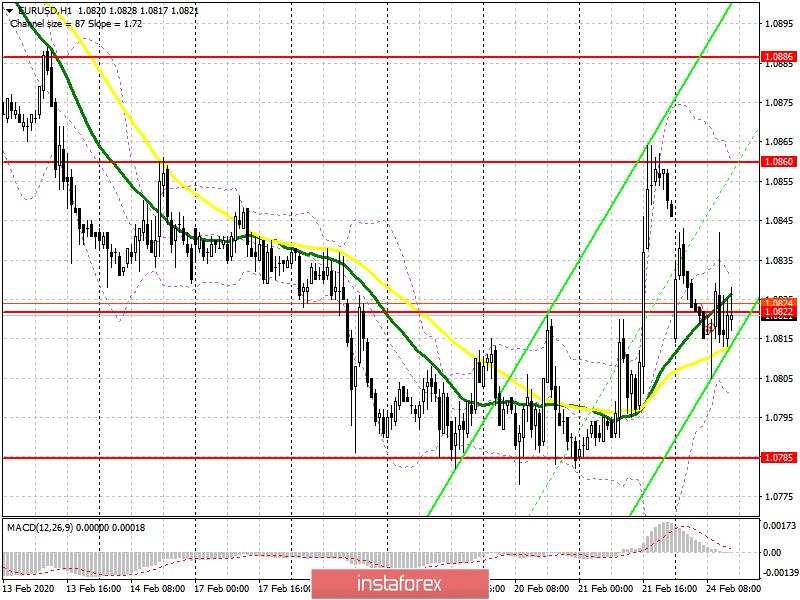
To open long positions on EURUSD, you need:
In the first half of the day, I paid attention to the level of 1.0822, around which trading continues. The bears took the initiative, pushing the pair under this range. Data on the German business environment indicator, which rose slightly in February this year compared to January, did not provide significant support for the euro. Buyers in the second half of the day need to return to the level of 1.0822, since only in this scenario can we expect a repeated growth to the maximum of last week in the area of 1.0860, where I recommend fixing the profits. Given that there are no important fundamental statistics in the afternoon, probably the advantage will remain with the sellers of the euro. In the case of reduction, it is best to return to long positions to rebound from the low of the year at 1.0785 or after updating the larger area of 1.0765.
To open short positions on EURUSD, you need:
The bears coped with the task for the first half of the day and returned the euro to the level of 1.0820. While trading is below this range, we can expect a decline in the pair, especially after news of an increase in coronavirus infections in Italy. Bears will count on the test of the minimum of 1.0785, the breakdown of which will lead to a rapid decline in EUR/USD to the new levels of 1.0765 and 1.0740, where I recommend fixing the profits. In the scenario of the pair's growth in the second half of the day above the area of 1.0822, it is best to return to short positions on a false breakdown from the maximum of 1.0860 or sell the euro immediately on a rebound from the level of 1.0886.
Signals of indicators:
Moving averages
Trading is conducted in the area of 30 and 50 moving averages, which indicates market uncertainty in the short term.
Bollinger Bands
A break of the lower border of the indicator in the region of 1.0800 will increase pressure on the euro. Growth will be limited by the upper level at 1.0860.

Description of indicators
- Moving average (moving average determines the current trend by smoothing out volatility and noise). Period 50. The graph is marked in yellow.
- Moving average (moving average determines the current trend by smoothing out volatility and noise). Period 30. The graph is marked in green.
- MACD indicator (Moving Average Convergence / Divergence - moving average convergence / divergence) Fast EMA period 12. Slow EMA period 26. SMA period 9
- Bollinger Bands (Bollinger Bands). Period 20
 English
 Русский
 Bahasa Indonesia
 Bahasa Malay
 ไทย
ไทย Español
 Deutsch
 Български
 Français
 Tiếng Việt
 中文
中文 বাংলা
বাংলা हिन्दी
 Čeština
 Українська
 Română

