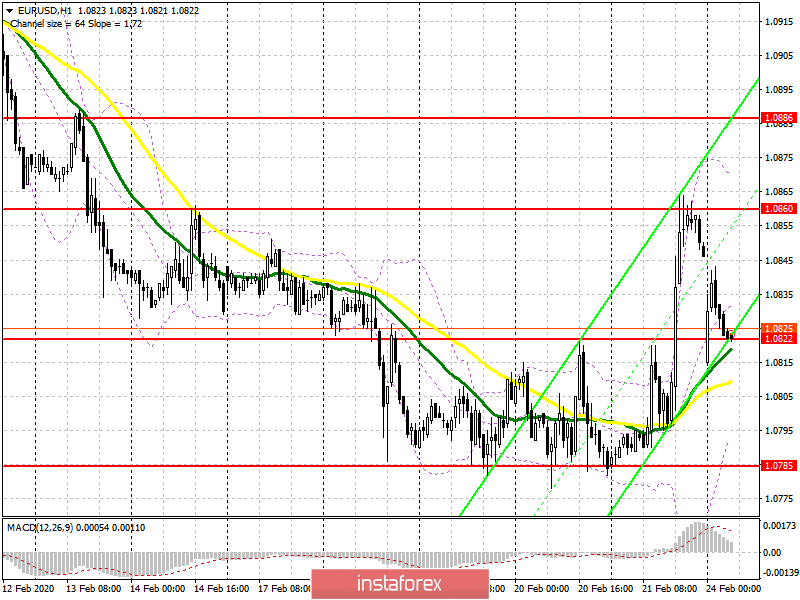
To open long positions on EURUSD you need:
On Friday, it was possible to observe the upward correction in the European currency after the breakout of the resistance of 1.0822, but it all ended in the area of the high of 1.0860, which I repeatedly paid attention to in my reviews. The emergence of coronavirus in Italy again discouraged investors from buying euros, and now the bulls need to protect 1.0820, because we can only expect a return to a high of 1.0860 if a false breakout forms there, which is where I recommend taking profits. If there is no activity on the part of large players in this range in the first half of the day, then long positions are best left aside until this year's low test in the 1.0785 area. An equally important task of the bulls will be to break and consolidate above the resistance of 1.0860, which will strengthen the correction and lead EUR/USD to the area of 1.0886.
To open short positions on EURUSD you need:
On Friday, the bears retreated from the market after the breakout of resistance of 1.0820, which occurred against the backdrop of weak data on manufacturing activity and the service sector in the United States. Currently, the problems of coronavirus infection are helping sellers, but first of all they need to cope with the support of 1.0820, a breakthrough of which will lead to the euro's quick return to the low of this year, and its breakout will open a direct path to the levels of 1.0765 and 1.0740, where I recommend taking profits. In case the pair grows in the morning, only the formation of a false breakout in the 1.0860 area will be a signal to open short positions in euros. I recommend selling immediately on the rebound only after a test of a high of 1.0886.
Signals of indicators:
Moving averages
Trade is conducted slightly above 30 and 50 moving averages, which now act as support for the European currency.
Bollinger bands
In case the euro falls, the lower boundary of the indicator will provide support around 1.0795. You can sell immediately on the rebound from the upper boundary in the 1.0870 area.

Description of indicators
- Moving average (moving average determines the current trend by smoothing out volatility and noise). Period 50. The graph is marked in yellow.
- Moving average (moving average determines the current trend by smoothing out volatility and noise). Period 30. The graph is marked in green.
- MACD indicator (Moving Average Convergence / Divergence - moving average convergence / divergence) Fast EMA period 12. Slow EMA period 26. SMA period 9
- Bollinger Bands (Bollinger Bands). Period 20
 English
 Русский
 Bahasa Indonesia
 Bahasa Malay
 ไทย
ไทย Español
 Deutsch
 Български
 Français
 Tiếng Việt
 中文
中文 বাংলা
বাংলা हिन्दी
 Čeština
 Українська
 Română

