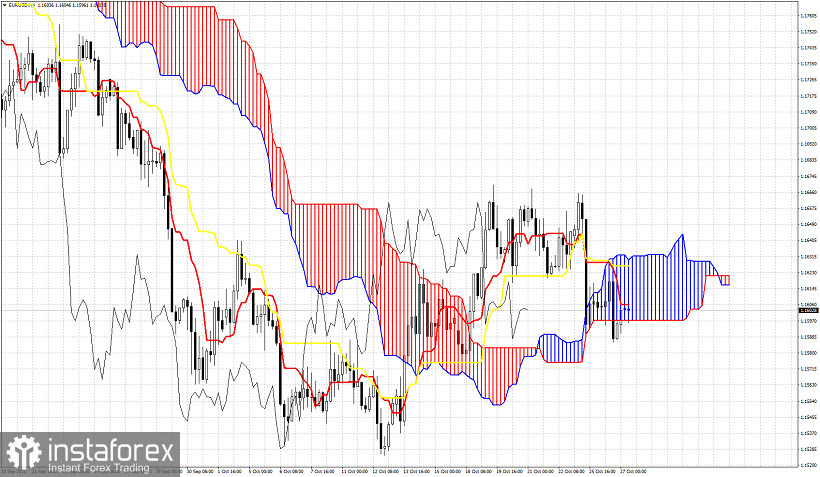
EURUSD is trading around 1.1610. In the 4hour chart according to the Ichimoku cloud indicator trend is neutral as price is inside the Kumo (cloud). In the Daily chart trend remains bearish and bulls have a lot of obstacles to overcome in order to reclaim control of the trend.


In the Daily chart price is below both the tenkan-sen (red line indicator) and kijun-sen (yellow line indicator). Resistance by the tenkan-sen and kijun-sen is at 1.1620-1.1640. Breaking above this resistance area will open the way for a move towards the Daily Kumo resistance at 1.1720-1.1750. Concluding, EURUSD as long as it trades below 1.1640 is vulnerable to more downside. Support is at 1.16. For a move towards 1.1720-1.1750 bulls will need to break first above 1.1640.
 English
 Русский
 Bahasa Indonesia
 Bahasa Malay
 ไทย
ไทย Español
 Deutsch
 Български
 Français
 Tiếng Việt
 中文
中文 বাংলা
বাংলা हिन्दी
 Čeština
 Українська
 Română

