To open long positions on EURUSD, you need:
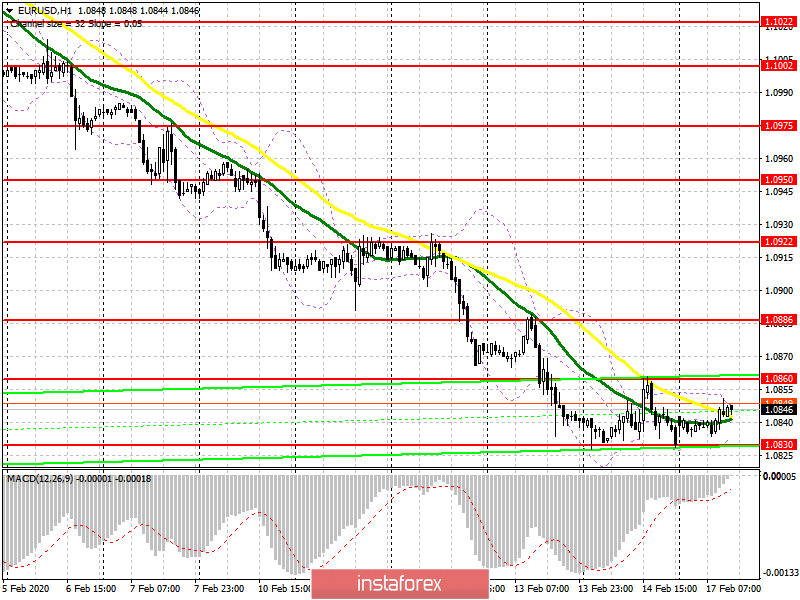
From a technical point of view, nothing changed in the first half of the day. The euro recovered while volatility remained extremely low. Presidential Day in the United States and low trading volume awaits us in the future. With purchases, you need to proceed carefully. Only the formation of a false breakdown at the level of 1.0830 will confirm the actual presence of buyers in the market, which will allow you to reach the resistance of 1.0860, a break of which will lead the pair to a maximum of 1.0886, where I recommend fixing the profits. In the scenario of a further fall in the euro, you can look at long positions for a rebound from the minimum of 1.0804 or even lower in the support area of 1.0773.
To open short positions on EURUSD, you need:
Sellers of the euro need a breakthrough of 1.0830, which will lead to a further sale in the area of the lows of 1.0804 and 1.0773, where I recommend fixing the profits. However, given the absence of important fundamental statistics today, the Eurogroup meeting and US Presidential Day, we can expect a small upward correction in EUR/USD to continue to the resistance area of 1.0860, where an unsuccessful attempt to consolidate above this range will be the first signal to open short positions. You can sell the euro immediately on a rebound from the maximum of 1.0886.
Signals of indicators:
Moving averages
Trading is conducted in the area of 30 and 50 moving averages, which indicates market uncertainty.
Bollinger Bands
Volatility remains extremely low, which does not give signals to enter the market.

Description of indicators
- Moving average (moving average determines the current trend by smoothing out volatility and noise). Period 50. The graph is marked in yellow.
- Moving average (moving average determines the current trend by smoothing out volatility and noise). Period 30. The graph is marked in green.
- MACD indicator (Moving Average Convergence / Divergence - moving average convergence / divergence) Fast EMA period 12. Slow EMA period 26. SMA period 9
- Bollinger Bands (Bollinger Bands). Period 20
 English
 Русский
 Bahasa Indonesia
 Bahasa Malay
 ไทย
ไทย Español
 Deutsch
 Български
 Français
 Tiếng Việt
 中文
中文 বাংলা
বাংলা हिन्दी
 Čeština
 Українська
 Română

