4-hour timeframe

Technical details:
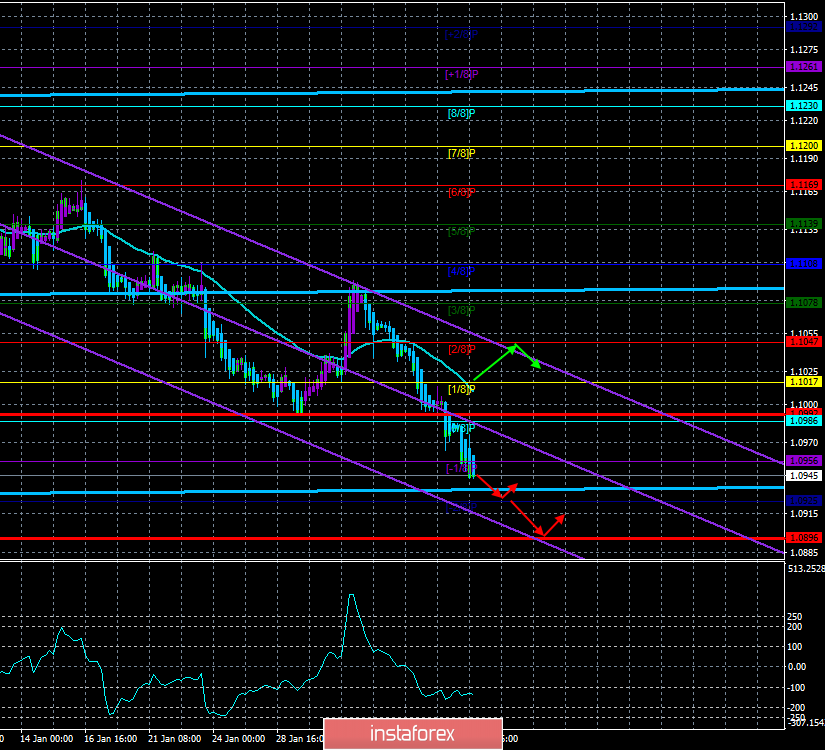
Higher linear regression channel: direction - sideways.
Lower linear regression channel: direction - downward.
Moving average (20; smoothed) - down.
CCI: -138.7153
At the end of the last trading week, the euro fell even more, and hopes for a correction finally collapsed when macroeconomic statistics were published in the United States, which showed the excellent state of the labor market. Thus, the fall of the EUR/USD currency pair continues, at least this is what the Heiken Ashi indicator signals, painting the bars blue. On Monday, February 10, there will be no important macroeconomic publications either in the European Union or in the United States. However, during the rest of the week, there will be quite a large number of important statistics and events. Thus, traders can use Monday to partially fix profits on short positions. After all, on Tuesday, Jerome Powell will make his first speech to Congress, which will clearly address the issues of the economy, monetary policy, and global risks. Thus, if the markets receive any new information, the reaction can follow immediately. We do not expect "dovish rhetoric" from Jerome Powell, respectively, and the fall of the US currency on the basis of this event – either. However, it should be understood that such a high-profile event can be used to manipulate the dollar exchange rate. Recall that in the first two years of his cadence, Donald Trump regularly stated that he did not need an "expensive dollar" and would make every effort to devalue the national currency. It failed to depreciate because other central banks also worked synchronously to reduce the exchange rate of their currencies, so the following events began: criticism of Jerome Powell, "hawkish" monetary policy, and regular calls to lower the key rate, which, according to Trump, would lead to a cheaper US currency in the foreign exchange market. The Fed lowered the rate three times, however, this did not lead to a special fall in the dollar. The US economy was stimulated and began to accelerate again. Also, the rise in the price of the dollar resumed. Thus, there may be surprises in Jerome Powell's speech, although the probability of this is extremely low. We believe that Powell will simply repeat in Congress all the theses that he regularly repeats after the Fed meetings, respectively, no new information will be available to traders.
Thus, a correction may begin today, which is likely to continue on Tuesday. Of course, we recommend not to guess the possible reversals of the currency pair but to react to the readings of the fastest indicator – Heiken Ashi. Moreover, there are no macroeconomic publications scheduled for Monday, which means that there will be no influence on the fundamental background. In general, we still recommend working out all sell signals, since the general fundamental background clearly remains on the side of the US currency. Keeping in mind only the "paradoxical situation", that only 60 points remain to the pair's two-year lows. But even in the case of another difficult-to-explain reduction in dollar positions on the approach to the minimum level of 1.0879, the Heiken Ashi indicator will turn up and indicate a round of corrective movement.
Meanwhile, trade tensions between the United States and China are slowly easing. It is reported that China is lowering duties on several goods from America for a total of $75 billion from February 14. However, as in the case of American duties, most of the restrictive measures continued to operate. However, the countries are gradually moving towards the point of a complete truce. Instead, Washington expanded duties on imports of steel, aluminum from other countries, as well as many products from this raw material, including nails, paper clips, wire, and cables. Contrary to the effect that Trump wanted to achieve by imposing duties on these categories of raw materials, imports to the United States only increased. This time, Trump has accused absolutely all countries importing steel and aluminum into the United States, allegedly they bypass duties and deliver goods not included in the initial list to the United States. Well, Trump is only confirming the opinion that sooner or later he will start trade wars with all his trading partners. The European Union is next...

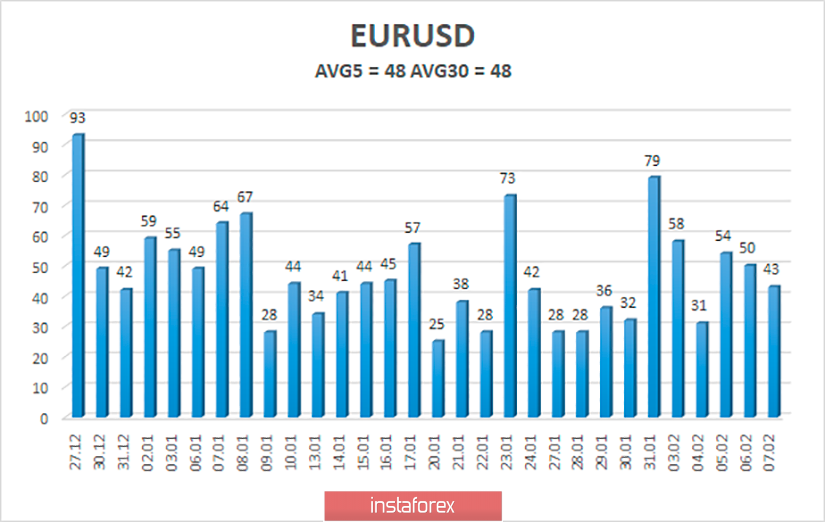
The average volatility of the euro/dollar currency pair has decreased slightly but is stable at 50 points per day. For the euro currency, this is an average and absolutely normal indicator. Thus, on Monday, we expect movement between the borders of the volatility range of 1.0896-1.0992. However, most likely, a correction will begin, which can be determined by the reversal of the Heiken Ashi indicator to the top.
Nearest support levels:
S1 - 1.0925
Nearest resistance levels:
R1 - 1.0956
R2 - 1.0986
R3 - 1.1017
Trading recommendations:
The euro/dollar pair continues to move down. Thus, sales of the euro currency with the targets of 1.0925 and 1.0896 remain relevant now, until the Heiken Ashi indicator turns up. It is recommended to return to buying the EUR/USD pair not before the bulls cross the moving average line, which will change the current trend to an upward one, with the first targets of 1.1047 and 1.1078.
In addition to the technical picture, you should also take into account the fundamental data and the time of their release.
Explanation of the illustrations:
The highest linear regression channel is the blue unidirectional lines.
The lowest linear regression channel is the purple unidirectional lines.
CCI - blue line in the indicator window.
Moving average (20; smoothed) - blue line on the price chart.
Murray levels - multi-colored horizontal stripes.
Heiken Ashi is an indicator that colors bars in blue or purple.
Possible variants of the price movement:
Red and green arrows.
 English
 Русский
 Bahasa Indonesia
 Bahasa Malay
 ไทย
ไทย Español
 Deutsch
 Български
 Français
 Tiếng Việt
 中文
中文 বাংলা
বাংলা हिन्दी
 Čeština
 Українська
 Română

