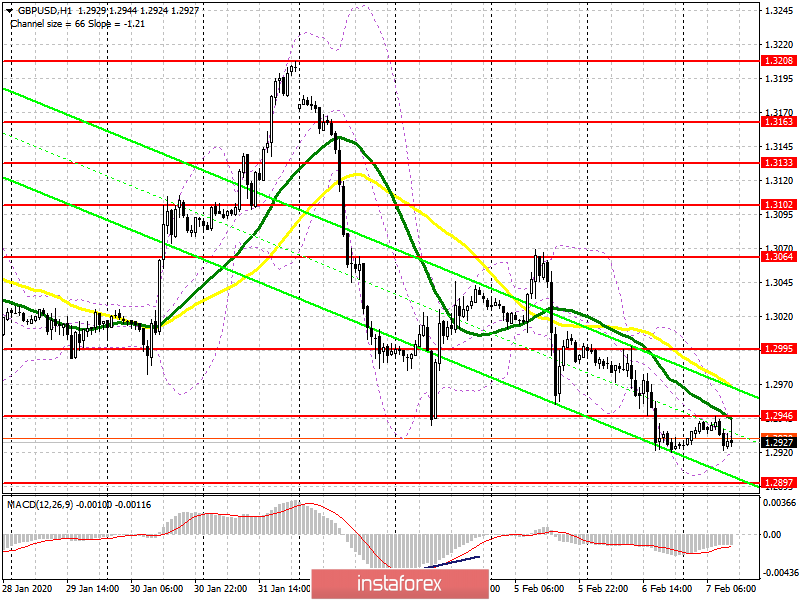
To open long positions on GBPUSD, you need:
The situation in the British pound continues to be on the side of the sellers, and the bulls should now pay attention to the resistance level of 1.2946, a return to which will lead to a larger upward correction in the area of the maximum of 1.2995, and the longer-term goal will be the resistance of 1.3064, where I recommend fixing the profit. If the report on the state of the US labor market will please traders, the pound may move sharply down to the support area of 1.2897 and 1.2867, where it is best to buy only after the formation of a false breakdown and confirmation of the level. But it is best to open long positions immediately on the rebound from the minimum of 1.2830.
To open short positions on GBPUSD, you need:
Bears are in no hurry to push the market further down, as they are waiting for an important report on the unemployment rate in the United States. The risk of profit-taking on short positions after the report is quite high, so only an unsuccessful fixing of GBP/USD above the level of 1.2946 will be a signal to open short positions in the calculation of updating the lows of 1.2897 and 1.2867, where I recommend fixing the profits. If the bears release the resistance of 1.2946, then it is best to open long positions on a rebound from the maximum of 1.2995, above which there is a void, so do not forget about the placement of stop orders. The nearest resistance level after 1.2995 is 1.3064, where you can also safely open short positions immediately for a rebound.
Signals of indicators:
Moving averages
Trading is below the 30 and 50 daily averages, which indicates a further decline in the pound in the short term.
Bollinger Bands
Volatility has decreased, which does not give signals to enter the market.

Description of indicators
- Moving average (moving average determines the current trend by smoothing out volatility and noise). Period 50. The graph is marked in yellow.
- Moving average (moving average determines the current trend by smoothing out volatility and noise). Period 30. The graph is marked in green.
- MACD indicator (Moving Average Convergence / Divergence - Moving Average Convergence / Divergence) Fast EMA Period 12. Slow EMA Period 26. SMA Period 9
- Bollinger Bands (Bollinger Bands). Period 20
 English
 Русский
 Bahasa Indonesia
 Bahasa Malay
 ไทย
ไทย Español
 Deutsch
 Български
 Français
 Tiếng Việt
 中文
中文 বাংলা
বাংলা हिन्दी
 Čeština
 Українська
 Română

