To open long positions on EURUSD, you need:
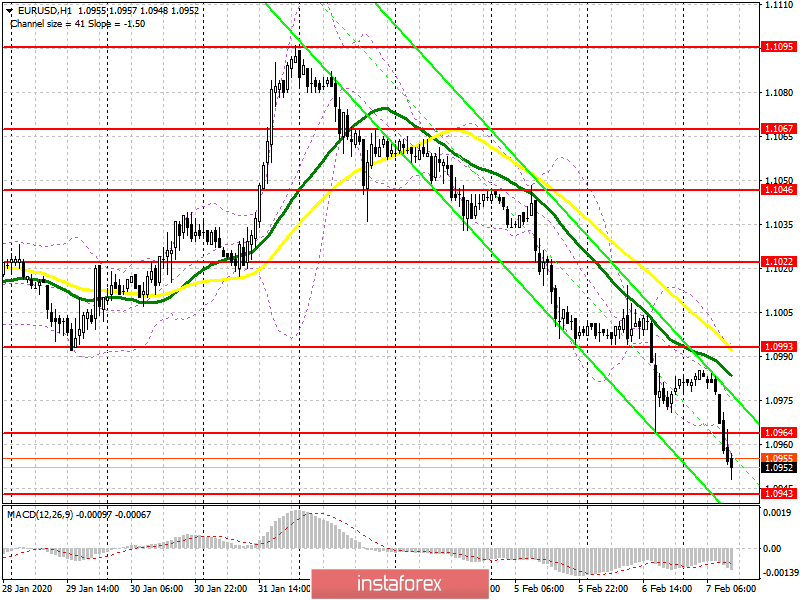
In the morning, I paid attention to the report on industrial production in Germany, which remains in a pretty bad state, and a drop of 3.5% in output in December immediately led to a sharp decline in the euro under the lows of this week. At the moment, the bulls will focus on holding the support of 1.0943, which can be tested after the release of data on the number of people employed in the US non-agricultural sector. The formation of a false breakdown at this level with a surge in volume will also indicate the closing of short positions in the euro, which may lead to a rebound of EUR/USD up in the afternoon to the resistance area of 1.0964. Fixing above this level will be a good signal to open long positions in order to update the maximum of 1.0993, where I recommend fixing the profits. In the scenario of a failure of the level of 1.0943 on the US labor market data, it is best to consider new long positions for a rebound from the minimum of 1.0905.
To open short positions on EURUSD, you need:
A new task for sellers who managed to break through this week's low is to hold the level of 1.0964, which is now acting as a resistance. The formation of a false breakdown in this range and good data on the US labor market may lead to a new wave of decline in the pair with the test of the lows of 1.0943 and 1.0905. However, if a sharp downward movement under the level of 1.0943 is not formed even after strong data on the state of the US labor market, it is likely that major players come out on this report and fix their short positions, which sooner or later will lead to a sharp rebound of the euro up. In the scenario of the bulls returning to their resistance of 1.0964 in the second half of the day, I advise you to pay attention to sales only after updating the maximum of 1.0993.
Signals of indicators:
Moving averages
Trading is conducted below the 30 and 50 moving averages, which indicates a predominance of sellers.
Bollinger Bands
If the euro recovers in the second half of the day, the upper limit of the indicator 1.0993 will act as a resistance.

Description of indicators
- Moving average (moving average determines the current trend by smoothing out volatility and noise). Period 50. The graph is marked in yellow.
- Moving average (moving average determines the current trend by smoothing out volatility and noise). Period 30. The graph is marked in green.
- MACD indicator (Moving Average Convergence / Divergence - Moving Average Convergence / Divergence) Fast EMA Period 12. Slow EMA Period 26. SMA Period 9
- Bollinger Bands (Bollinger Bands). Period 20
 English
 Русский
 Bahasa Indonesia
 Bahasa Malay
 ไทย
ไทย Español
 Deutsch
 Български
 Français
 Tiếng Việt
 中文
中文 বাংলা
বাংলা हिन्दी
 Čeština
 Українська
 Română

