GBP/USD
Analysis:
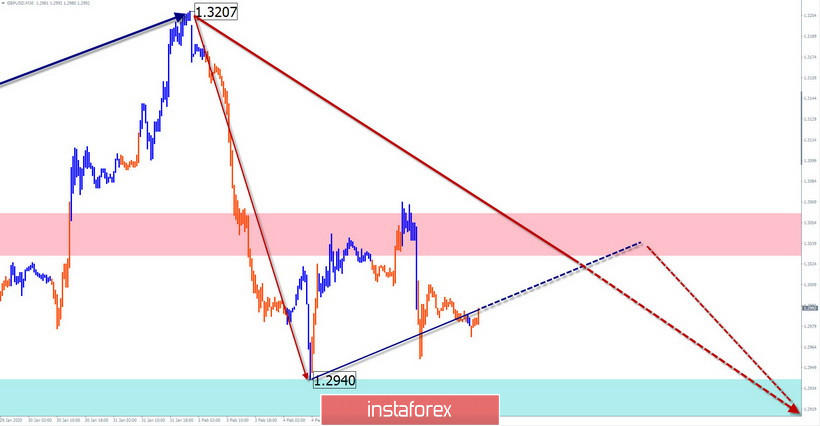
On the chart of the British pound, the trend wave is directed upwards. In the short term, the dominant direction is set by the corrective bearish wave of December 13. A week ago, the final part (C) started in the wave structure and the price forms a pullback in its framework in the last 2 days.
Forecast:
In the coming day, the price movement is expected to continue in the side corridor between the nearest counter zones. Until the correction is complete, the pair's rate will not decrease and the completion of the growth can be expected at the end of the day or tomorrow.
Potential reversal zones
Resistance:
- 1.3030/1.3060
Support:
- 1.2940/1.2910
Recommendations:
Today, purchases of the pound are only possible with an in-session trading style. It is better to lower the lot. It is safer to refrain from entering the pair's market during the price rise and look for selling points at the end of it.

USD/JPY
Analysis:
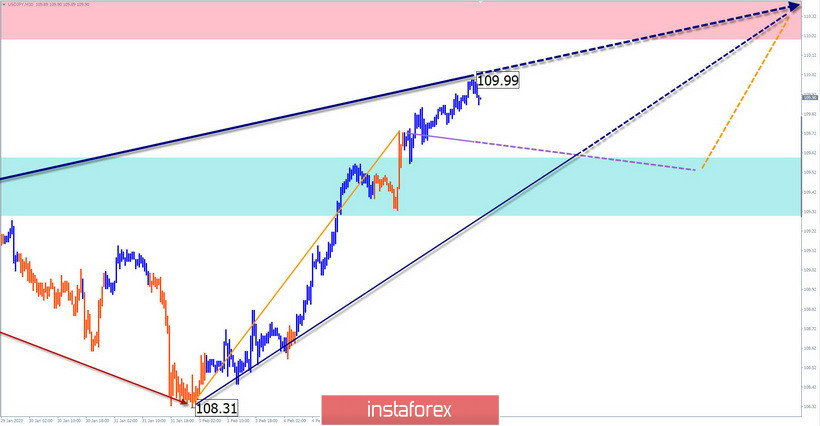
The trend direction of the Japanese currency since August last year looks at the "north" of the chart. On January 8, its last section started and the first parts (A-B) are completed in the movement structure. When the final rise is formed, the price approaches the strong resistance of a large TF.
Forecast:
It is unlikely that the price today will be able to break through a strong counter level without stopping. Most likely, after contact with the resistance zone, the price will lie in the "sideways" or begin to roll back down to the support zone. A breakthrough beyond the settlement zones is not expected today.
Potential reversal zones
Resistance:
- 110.20/110.50
Support:
- 109.60/109.30
Recommendations:
Selling a pair today can be very risky. It is recommended to refrain from entering the yen market until clear signals appear to buy the instrument.

Explanations: In the simplified wave analysis (UVA), waves consist of 3 parts (A-B-C). The last incomplete wave is analyzed. The solid background of the arrows shows the formed structure and the dotted background shows the expected movements.
Note: The wave algorithm does not take into account the duration of the tool's movements in time!
 English
 Русский
 Bahasa Indonesia
 Bahasa Malay
 ไทย
ไทย Español
 Deutsch
 Български
 Français
 Tiếng Việt
 中文
中文 বাংলা
বাংলা हिन्दी
 Čeština
 Українська
 Română

