Economic calendar (Universal time)
There are no important events in today's economic calendar.
EUR / USD

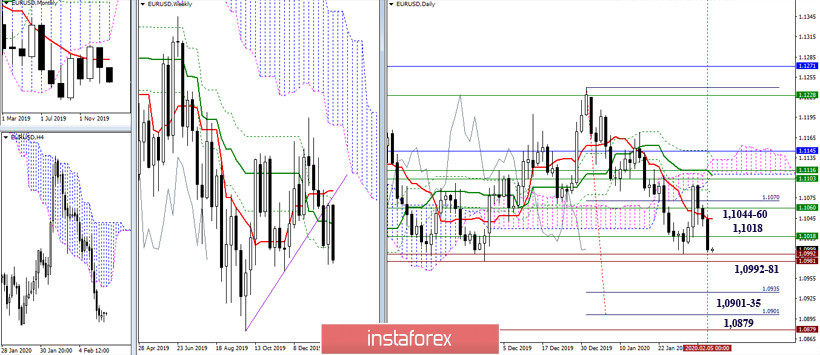
Players on the decline continue to attack. On the other hand, updating the lows of 1.0992-81 will allow us to consider the continuation of the decline to the main benchmarks of this section - the daily target for breakdown of the cloud (1.0901-35) and the minimum extremum (1.0879) , which separates the pair from the restoration of the monthly downward trend. The nearest resistances are now 1.1018 (the final level of the weekly golden cross) and 1.1044-60 (daily Tenkan + weekly Kijun).

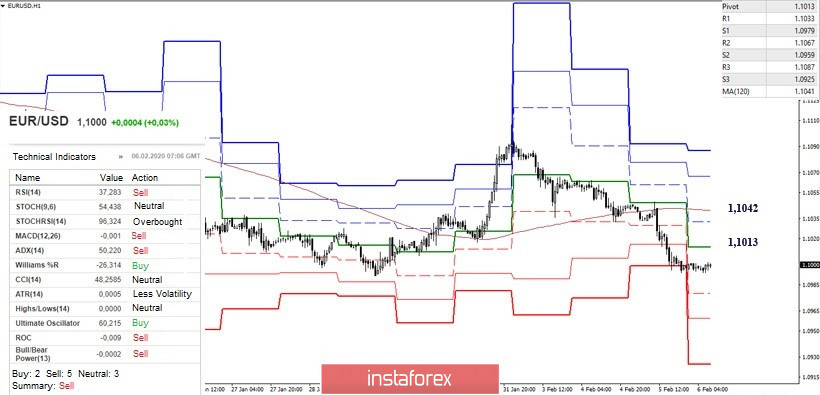
Yesterday, the players on the downside, having fixed themselves below key levels, managed to push off from them and continue to decline. Today, the favor are entirely on the side of the bears. The downward trends for them within the day are support for the classic levels of 1.0979 - 1.0959 - 1.0925. The most significant resistances that determine the distribution of forces on H1 are currently located at 1.1013 (central Pivot level) and 1.1042 (weekly long-term trend).
GBP / USD

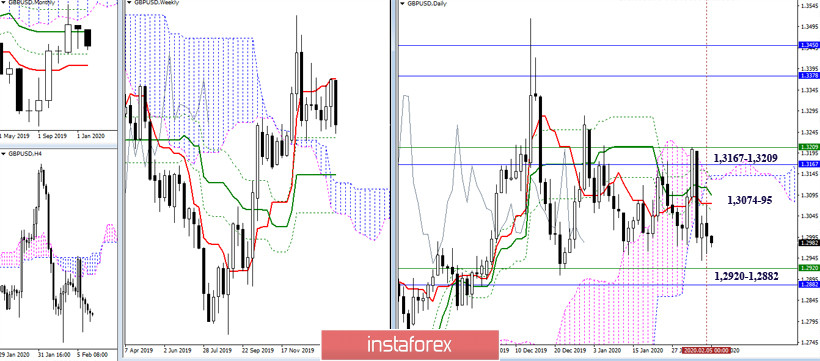
The players on the downside continue to fight for a bearish future for the pound, but the pair still remains in the zone of consolidation and uncertainty. It will be possible to build further plans and consider new prospects only after the exit and reliable consolidation outside the borders of the current confrontation. The upper boundary lies between 1.3167 - 1.3209 (monthly Kijun + weekly Tenkan + daily cloud), while the lower boundaries can be identified at 1.2920 - 1.2882 (weekly and monthly Fibo Kijun).

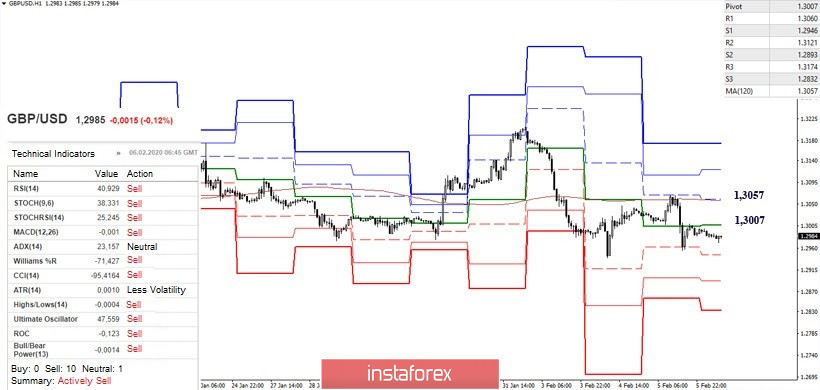
The weekly long-term trend (1.3057) remains in a horizontal position, thereby forming neutrality in the distribution of forces. The minimal advantage is now on the side of the bears, since work is carried out under the level (1.3057). The reference points for the intraday decline are the support of the classic Pivot levels 1.2946 - 1.2893 - 1.2832. At the same time, the nearest resistances today are the key levels for H1 - 1,3007 (central Pivot-level of the day) and 1.3057 (weekly long-term trend). When securing above, the scales will swing towards the players to increase. The following resistance of the classic Pivot levels 1.3121 and 1.3174 can become reference points in this case.
Ichimoku Kinko Hyo (9.26.52), Pivot Points (classic), Moving Average (120)
 English
 Русский
 Bahasa Indonesia
 Bahasa Malay
 ไทย
ไทย Español
 Deutsch
 Български
 Français
 Tiếng Việt
 中文
中文 বাংলা
বাংলা हिन्दी
 Čeština
 Українська
 Română

