To open long positions on GBPUSD, you need:
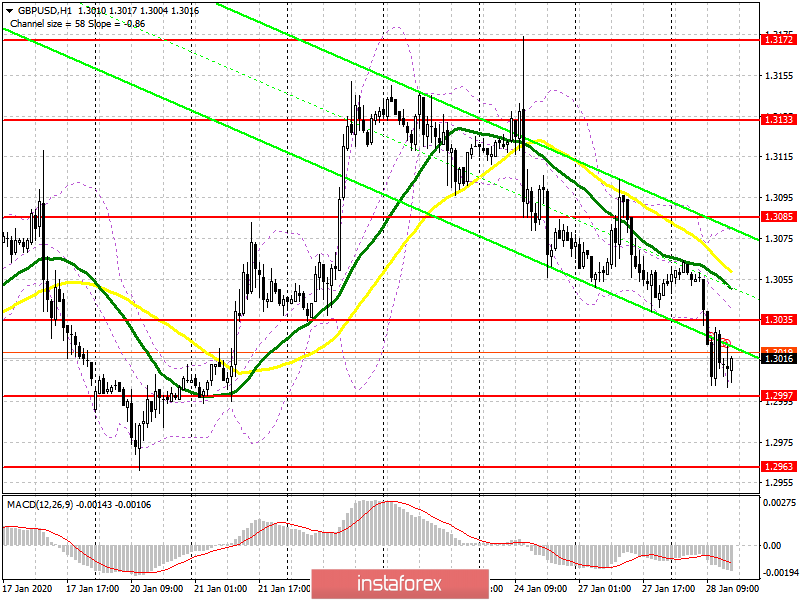
Even in the morning forecast, I paid attention to the breakdown of the level of 1.3035, which led to a further decline in the pound on the trend and the support test of 1.2997. At the moment, the bulls have no choice but to protect this range based on weak data on consumer confidence in the US and a return to the resistance of 1.3035. If there is no activity on the part of buyers in the area of 1.2997, it is best to postpone long positions until the test minimum of 1.2963, which coincides with the lows of January 20 and 14 this year. If consumer sentiment deteriorates in the US, the breakout and consolidation at the level of 1.3035 will quickly return buyers to the pound, which will lead to an update of the highs of 1.3085 and 1.3133, where I recommend fixing the profits.
To open short positions on GBPUSD, you need:
Sellers coped with the morning task and broke below 1.3035, which led to the update of the support of 1.2997, which I paid attention to in my morning forecast. Now, it is no less important to hold the resistance at 1.3035, and the formation of a false breakout at this level will be an additional signal for opening short positions in GBP/USD. Also, sellers of the pound can take advantage of good statistics on the American economy, which will lead to a breakthrough in support of 1.2997 and a further downward trend to the area of the lows of 1.2963 and 1.2939, where I recommend fixing the profits. In the scenario of the bulls returning to the level of 1.3035 in the afternoon, it is best to postpone short positions until the maximum of 1.3085 is updated.
Indicator signals:
Moving Averages
Trading is conducted below the 30 and 50 daily averages, which indicates a further decline of the pound on the trend.
Bollinger Bands
In the scenario of an upward correction, the upper limit of the indicator around 1.3080 will act as a resistance.

Description of indicators
- Moving average (moving average determines the current trend by smoothing out volatility and noise). Period 50. The graph is marked in yellow.
- Moving average (moving average determines the current trend by smoothing out volatility and noise). Period 30. The graph is marked in green.
- MACD indicator (Moving Average Convergence / Divergence - Moving Average Convergence / Divergence). Fast EMA Period 12. Slow EMA Period 26. SMA Period 9.
- Bollinger Bands (Bollinger Bands). Period 20.
 English
 Русский
 Bahasa Indonesia
 Bahasa Malay
 ไทย
ไทย Español
 Deutsch
 Български
 Français
 Tiếng Việt
 中文
中文 বাংলা
বাংলা हिन्दी
 Čeština
 Українська
 Română

