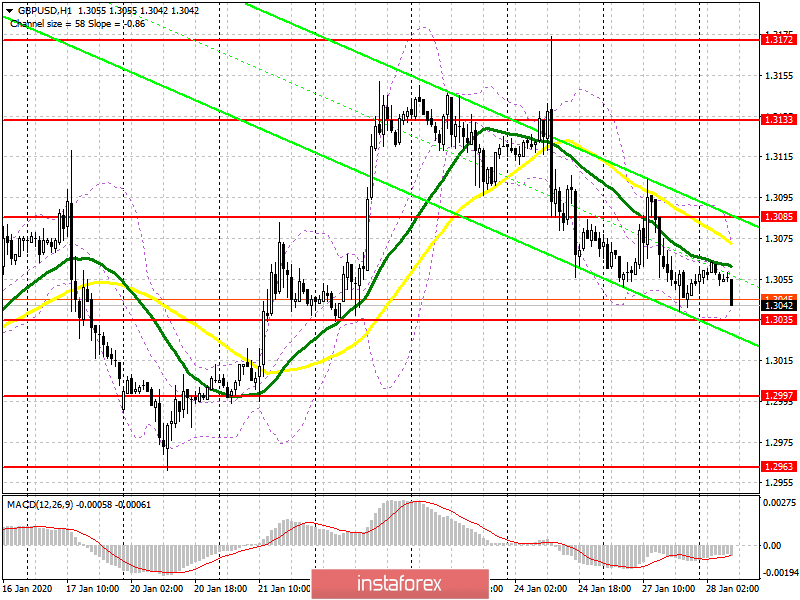
To open long positions on GBP/USD you need:
The situation with the pound has not changed much compared to yesterday's forecast, however, the bulls now have more problems than they had. The main problem is support at 1.3035, to which the pair gradually returned and only the formation of a false breakout in this range, which I doubt, will be a signal to open long positions. It is best to defer purchases until the test of lows 1.2997 and 1.2963. Given that important fundamental statistics for the UK are not published today, it is likely that the market will again be sawtooth pattern, with the demolition of intraday stop orders and the "smearing" of levels. An important goal for pound buyers is a return to resistance at 1.3085, since consolidating on this range will indicate the resumption of the upward trend of GBP/USD with updating highs of 1.3133 and 1.3172, where I recommend taking profits.
To open short positions on GBP/USD you need:
As long as trading is conducted below the range of 1.3085, pressure on the pound will be present, and the immediate target of the bears will be a low of 1.3035, consolidating below which will maintain a downward trend, which is formed from last Friday's high at 1.3172. Breakthrough at 1.3035 will quickly push GBP/USD to levels 1.2997 and 1.2963, where I recommend taking profit. However, without good fundamental statistics for the United States, it is unlikely that a bearish momentum can be sustained. In case the pound grows in the morning, short positions can be considered from resistance at 1.3085, subject to a false breakout, but I recommend selling immediately for a rebound only after updating the high of 1.3133 and 1.3172.
Signals of indicators:
Moving averages
Trading is below 30 and 50 moving averages, indicating that the pound could decline further in the short term.
Bollinger bands
A break of the lower boundary of the indicator at 1.3035 will raise the pressure on the pair. Growth will be limited by the upper level of the indicator at 1.3070.

Description of indicators
- Moving average (moving average determines the current trend by smoothing out volatility and noise). Period 50. The graph is marked in yellow.
- Moving average (moving average determines the current trend by smoothing out volatility and noise). Period 30. The graph is marked in green.
- MACD indicator (Moving Average Convergence / Divergence - moving average convergence / divergence) Fast EMA period 12. Slow EMA period 26. SMA period 9
- Bollinger Bands (Bollinger Bands). Period 20
 English
 Русский
 Bahasa Indonesia
 Bahasa Malay
 ไทย
ไทย Español
 Deutsch
 Български
 Français
 Tiếng Việt
 中文
中文 বাংলা
বাংলা हिन्दी
 Čeština
 Українська
 Română

