 English
  Русский
 Bahasa Indonesia
 Bahasa Malay
 ไทย
ไทย Español
 Deutsch
 Български
 Français
 Tiếng Việt
 中文
中文 বাংলা
বাংলা हिन्दी
 Čeština
 Українська
 Română

After the top test of the resistance line presented in a black bold line, the pair made a pullback downward movement on Friday and tested the pullback level of 50.0% equivalent to 1.3064, presented in a blue dashed line. Today, strong calendar news for the dollar is expected at 15:00 UTC. A possible continuation of work down.
Trend analysis (Fig. 1).
A downward movement is expected today with the target of 1.3033, the support line in a red bold line. In case of testing this line, work up with the target of 1.3072, the 21 average EMA presented in a black thin line.
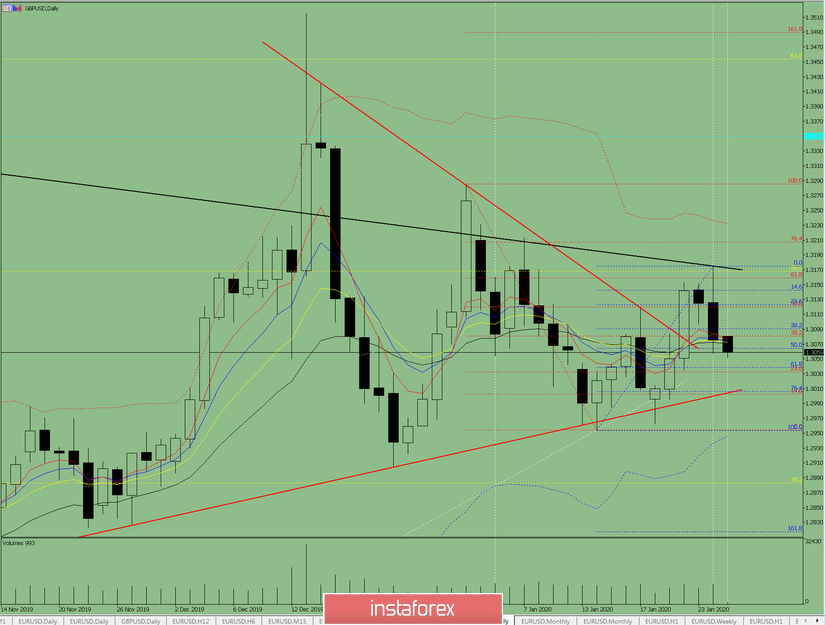
Fig. 1 (daily chart).
Comprehensive analysis:
- Indicator analysis - down;
- Fibonacci levels - down;
- Volumes - down;
- Candlestick analysis - down;
- Trend analysis - down;
- Bollinger lines - down;
- Weekly schedule - down.
General conclusion:
The price may continue to move down today.
A downward scenario is unlikely but quite possible, where, from the level of 1.3075, Friday afternoon's closing candle, work up with the target at 1.3177, the resistance line in a black bold line.