English
  Русский
 Bahasa Indonesia
 Bahasa Malay
 ไทย
ไทย Español
 Deutsch
 Български
 Français
 Tiếng Việt
 中文
中文 বাংলা
বাংলা हिन्दी
 Čeština
 Українська
 Română

AUD/USD
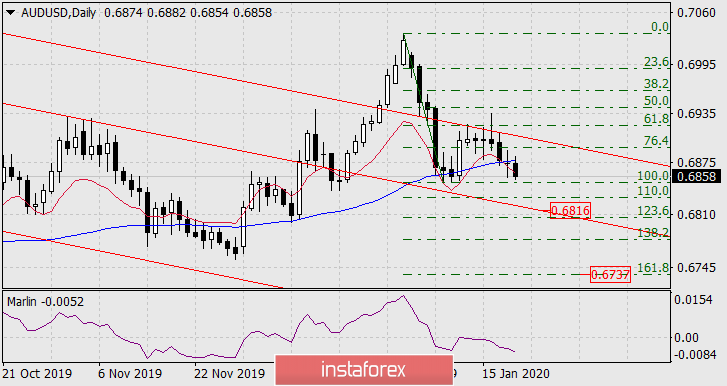
On the daily chart, the price was consolidated under the blue indicator line of MACD, which is an indicator of the trend and acts as an independent support/resistance. The Marlin oscillator is going down in the negative trend zone. The purpose of the movement is to support the embedded line of the price channel in the region of the Fibonacci reaction line of 123.6% at the price of 0.6816. The target level is at the lows of October 2019. Consolidation under the first target opens the second target at 0.6737 - the Fibonacci reaction level of 161.8%.
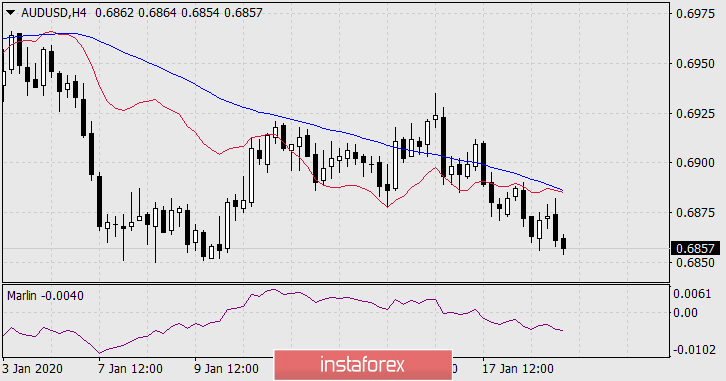
On a four-hour chart, the price is moving in a downward direction under the indicator lines of balance and MACD, Marlin is also falling. We look forward to further price movement towards the designated goal.