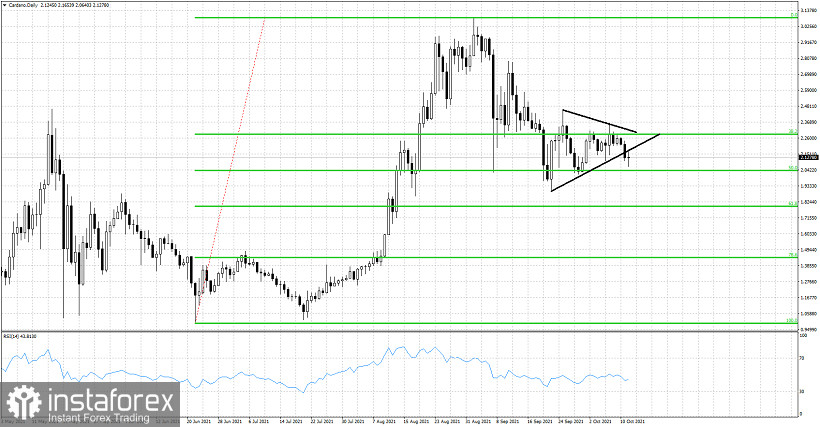
In our previous posts about Cardano price action, we noted that price was expected to break out of the triangle until October the 15th the latest. Price today broke below the lower triangle boundary and provided us with a bearish signal.

Black lines - triangle pattern
Cardano is trading at $2.12. Price is now below the lower triangle boundary. Support is found at the 50% retracement at $2.03 and failure to hold above this level will be another bearish signal. Price is now vulnerable to a move towards $2.03 and lower as long as price is below $2.35. Bulls need to break above $2.35 in order to regain control of the trend. The triangle break down in Cardano has potential to push price towards $1.70. However we need to keep a close eye on the 61.8% Fibonacci retracement which is key support.
 English
 Русский
 Bahasa Indonesia
 Bahasa Malay
 ไทย
ไทย Español
 Deutsch
 Български
 Français
 Tiếng Việt
 中文
中文 বাংলা
বাংলা हिन्दी
 Čeština
 Українська
 Română

