Technical Market Outlook:
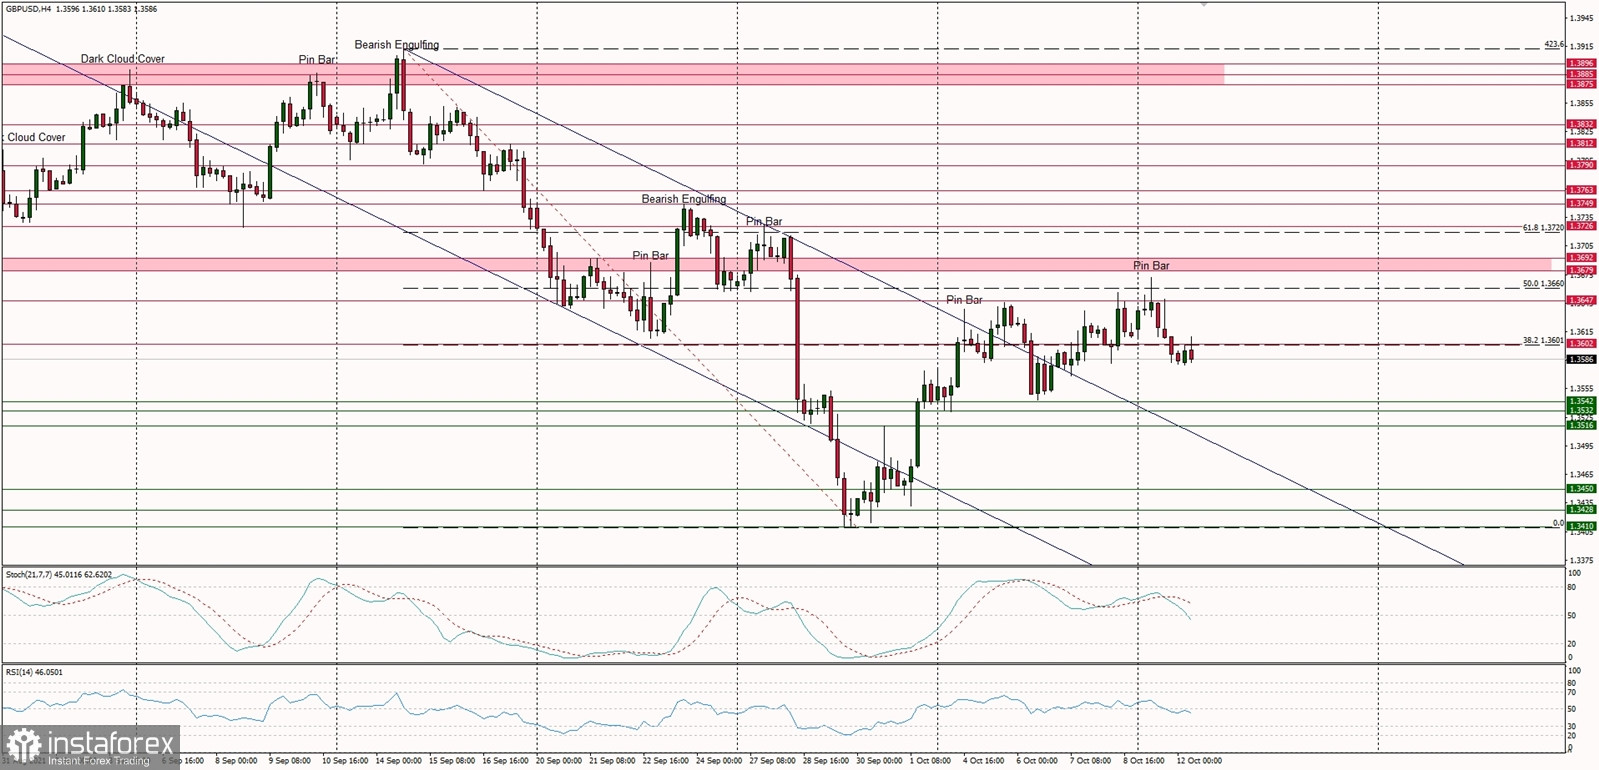
After the GBP/USD pair has hit the 50% Fibonacci retracement located at the level of 1.3660 the bearish pressure had increased and the market is slowly moving lower. The technical support is seen at 1.3608 was violated already, so the down trend can resume lower towards the last weeks low located at 1.3410 or below. The nearest technical support is seen at the level of 1.3542, 1.3532 and 1.3516 and if this levels are broken, the road to the last week low is open. On the other hand, the next target for bulls is 61% Fibonacci retracement located at 1.3720, but first they need to resume the rally and break through the level of 1.3660.
Weekly Pivot Points:
WR3 - 1.3798
WR2 - 1.3729
WR1 - 1.3675
Weekly Pivot - 1.3598
WS1 - 1.3549
WS2 - 1.3477
WS3 - 1.3424
Trading Outlook:
The weekly and monthly time frame chart show a breakout below the key technical support located at 1.3516, so now the bears are in total control of the market. The next target for bears is seen at the level of 1.3174. The levels of 1.3408 and 1.3371 might give some support for bulls as they are 55 and 200 weekly moving average levels.

 English
 Русский
 Bahasa Indonesia
 Bahasa Malay
 ไทย
ไทย Español
 Deutsch
 Български
 Français
 Tiếng Việt
 中文
中文 বাংলা
বাংলা हिन्दी
 Čeština
 Українська
 Română

