Gold price is at $1,756. The Ichimoku cloud indicator provides a contradicting result between the 4 hour chart and the Daily chart. This reflects the indecision and the lack of a clear direction in the specific market.
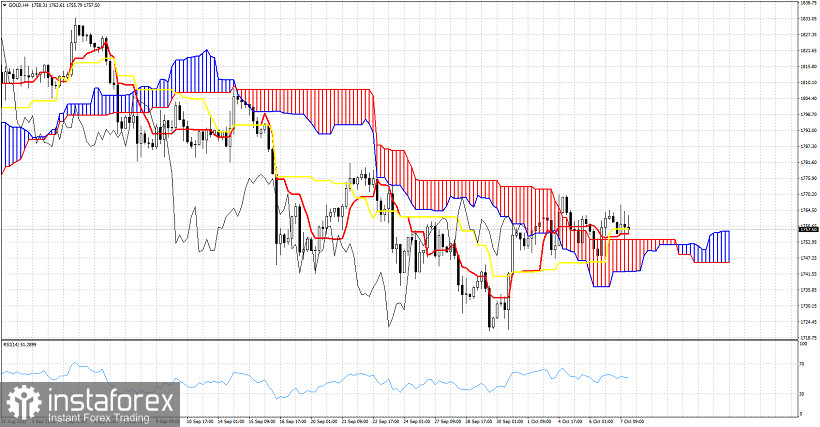
In the 4 hour chart Gold price is trading above the Kumo (cloud) and above both the tenkan-sen (Red line indicator) and the kijun-sen (yellow line indicator). However the tenkan-sen is below the kijun-sen. This is not a clear bullish confirmation, but staying above the cloud in the 4 hour chart is key for bulls to be able to change short-term trend to bullish. If the tenkan-sen crosses above the kijun-sen and price is above the Kumo, then we get a strong bullish signal.
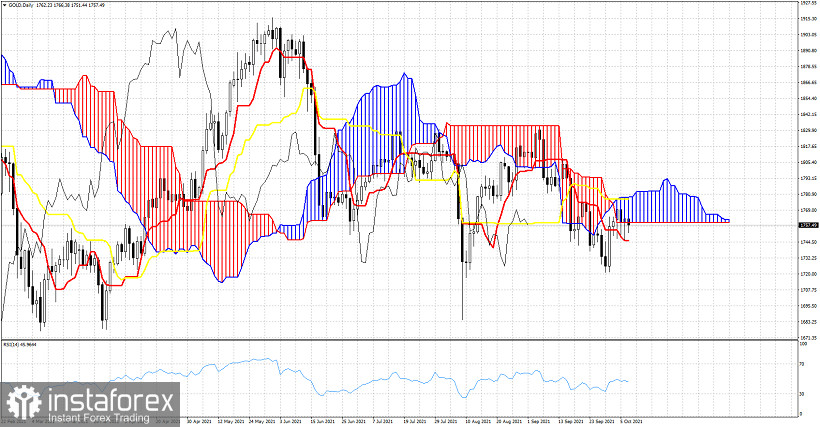
In the Daily chart we see Gold price trying to crawl inside the Kumo in order to change trend to neutral. Price is below the kijun-sen but above the tenkan-sen. The tenkan-sen provides support at $1,745. Breaking below this level will provide a bearish signal. Bulls need to push price above the cloud and the kijun-sen resistance at $1,778. If this happens then we will get an important bullish signal.
*The market analysis posted here is meant to increase your awareness, but not to give instructions to make a trade
 English
  Русский
 Bahasa Indonesia
 Bahasa Malay
 ไทย
ไทย Español
 Deutsch
 Български
 Français
 Tiếng Việt
 中文
中文 বাংলা
বাংলা हिन्दी
 Čeština
 Українська
 Română
 Relevance until