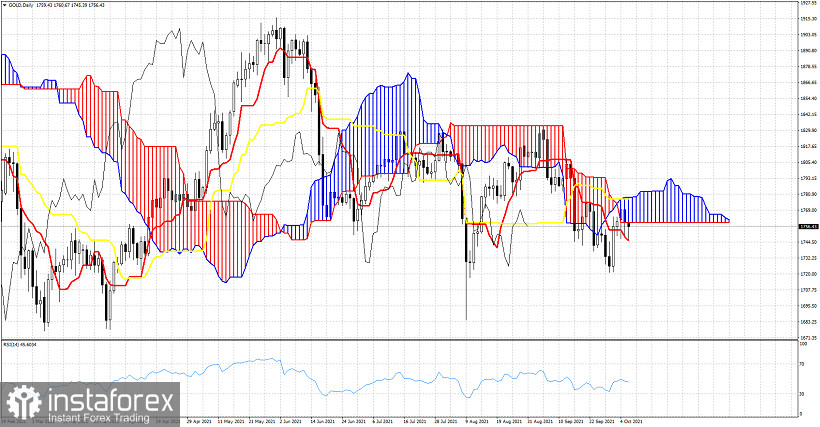
Gold price is trading at $1,758. In the Daily chart price is trying to enter the Ichimoku cloud. Price is still below the cloud and this means that bulls have still not taken control of the short-term trend despite the strong bounce from $1,720 to $1,770.

Price is trapped between the tenkan-sen (red line indicator) and the kijun-sen (yellow line indicator). Support by the tenkan-sen is at $1,748. A daily close below this level will be a sign of weakness. Resistance is at $1,769 by the lower cloud boundary and at $1,777 where we find both the kijun-sen and the upper cloud boundary. A bullish signal on a Daily basis will come when and if price breaks above $1,777.
*The market analysis posted here is meant to increase your awareness, but not to give instructions to make a trade

 English
 Русский
 Bahasa Indonesia
 Bahasa Malay
 ไทย
ไทย Español
 Deutsch
 Български
 Français
 Tiếng Việt
 中文
中文 বাংলা
বাংলা हिन्दी
 Čeština
 Українська
 Română

