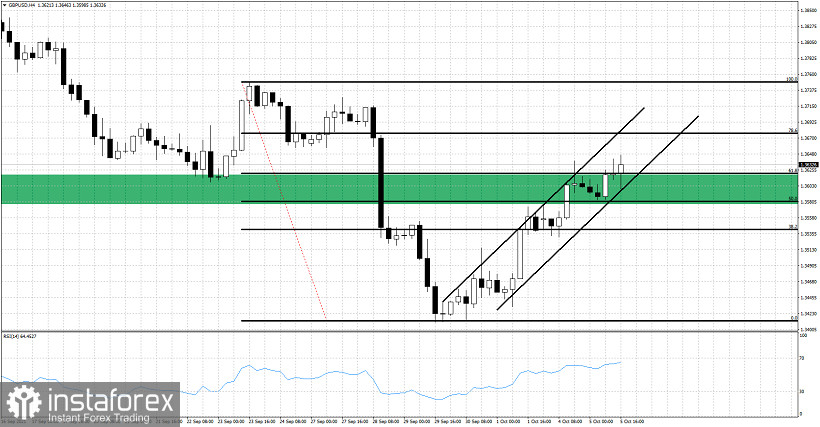
GBPUSD is now trading at 1.3638 and has broken above the key Fibonacci resistance at 1.3620. Staying above the 61.8% Fibonacci retracement will be crucial for the continuation of the current upward move.

Black upward sloping lines - bullish channel
Black horizontal lines - Fibonacci retracements
GBPUSD is inside a bullish channel. Price so far respects the boundaries of the channel and is making higher highs and higher lows. Next resistance is at the 78.6% retracement at 1.3675. Support is at today's lows at 1.3580 and as long as price is above this level, short-term trend will be controlled by bulls. Breaking below 1.3580 will be a sign of weakness and possibly of a reversal.
 English
 Русский
 Bahasa Indonesia
 Bahasa Malay
 ไทย
ไทย Español
 Deutsch
 Български
 Français
 Tiếng Việt
 中文
中文 বাংলা
বাংলা हिन्दी
 Čeština
 Українська
 Română

