Good day!
In this review, we will analyze the dollar/franc currency pair, where the main attention will be paid to technical analysis and positioning options for USD/CHF. However, first, we briefly talk about the important events of this week, which can make changes in the price dynamics of this quite interesting currency pair.
Of course, the main event of this week will be the meeting of the Open Market Committee (FOMC), following which the Fed's decision on rates will be known and updated economic forecasts will be published. Also, we expect the most important reports on the US consumer price index, which are the main indicator of inflationary pressure in the United States and have a direct impact on the steps of the Federal Reserve in monetary policy.
The Swiss National Bank (SNB) will not stand aside this week and will make its decision on the base interest rate. Also, the SNB will hold a press conference. It is worth noting here that after the most powerful interventions of 2011, the Swiss Central Bank is not particularly remembered. Unless completely discouraged the desire of market participants to mass purchases of the Swiss currency. As a result of these actions, the status of the Swiss franc as a safe-haven currency has become very blurred. I do not think that the tone of the SNB will change dramatically at the upcoming press conference, if at all.
Several more important macroeconomic reports from the US will be published. The date, time and forecasts for these and other events can be seen in the economic calendar. Now let's move on to the technical picture of USD/CHF and consider several charts of this currency pair.
Weekly

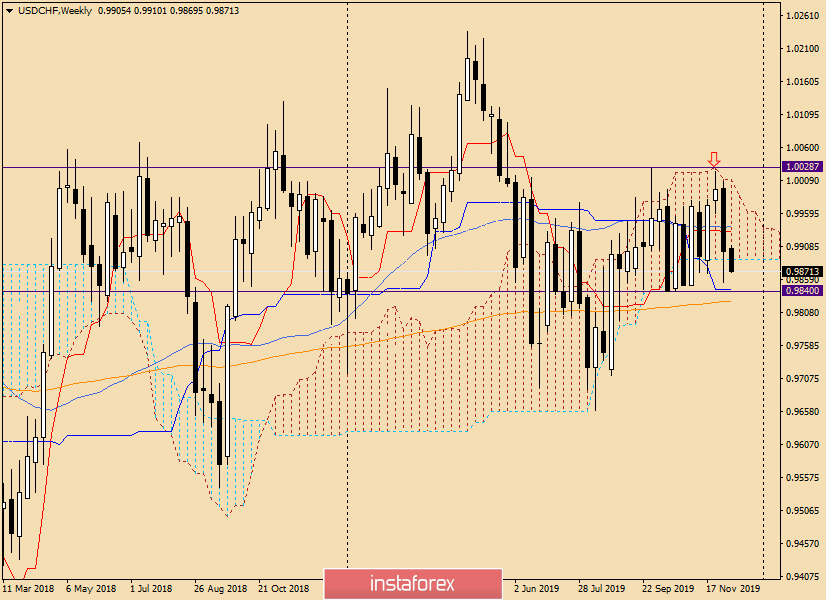
As previously expected, the pair met strong resistance at the upper boundary of the Ichimoku indicator cloud and could not get out of it up. After this unsuccessful attempt, the rate is quite expected to turn to the decline, and at the time of writing, it is already trading under the lower border of the cloud.
If the pressure on the pair continues, support can be expected in the area of 0.9843-0.9825, where the Kijun line and the 200-exponential moving average pass, respectively. Also, the horizontal support level of 0.9840 lies in this zone. This is a strong level that has repeatedly deployed the quote.
A break of 0.9825 and consolidation below this mark will finally indicate bearish sentiment for the pair. If bullish candlestick patterns appear in the area of 0.9850-0.9825, it is time to think about buying. In the meantime, the picture on the "week" is more uncertain, since it is unclear whether the bears will be able to bring the price down from the Ichimoku cloud and, most importantly, close the trading on December 9-13 under its lower border. Let's see how the picture looks on lower timeframes.
Daily

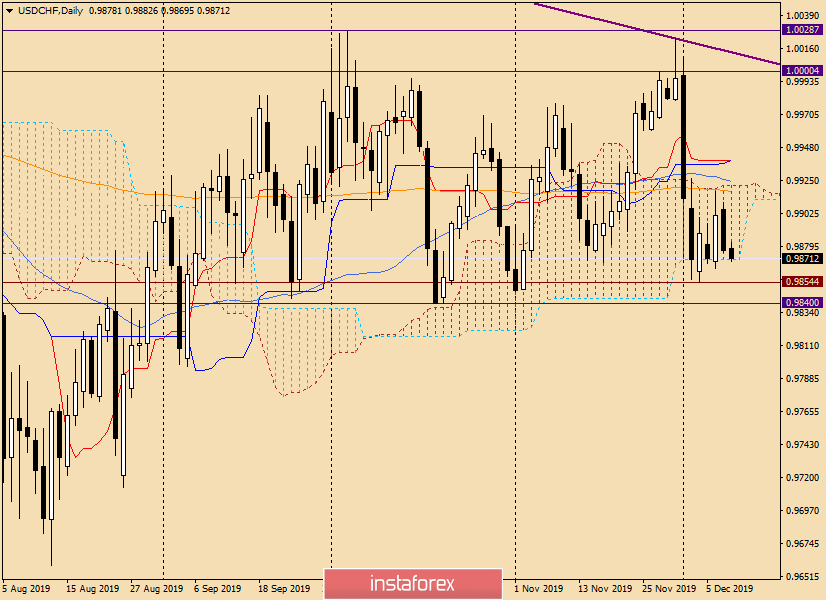
At this time interval, the picture is largely similar to that observed on the weekly TF. After the pair failed to move up from the Ichimoku cloud, encountering strong resistance in the form of 200 EMA, the course turned in a southerly direction and approached the lower boundary of the cloud. Most likely, the pair will go down and continue the downward movement, the nearest target of which will be the support at 0.9840. In my opinion, this is where the fate of USD/CHF will be decided. The breakout of 0.9840 and 0.9825 will point to the southern direction of the pair. The appearance of reversal candlestick signals near these levels will provoke, at least, a rebound up, and even change the downward trend to an upward one. At the same time, I do not rule out a possible reversal up from the lower border of the cloud, which passes at 0.9870.
To sum up, I think the main scenario for USD/CHF is bearish. This means that sales are the most priority positioning, but it is better to consider them after corrective pullbacks up to the levels of 0.9890 and 0.9910. Selling from current prices or at the breakdown of the support zone of 0.9855-0.9825 is risky. Here, when bullish candlesticks appear on the Daily, H4 and (or) H1, it is already worth looking at the purchases.
At the moment, this is a look at the dollar/franc currency pair.
Successful trading!
 English
 Русский
 Bahasa Indonesia
 Bahasa Malay
 ไทย
ไทย Español
 Deutsch
 Български
 Français
 Tiếng Việt
 中文
中文 বাংলা
বাংলা हिन्दी
 Čeština
 Українська
 Română

